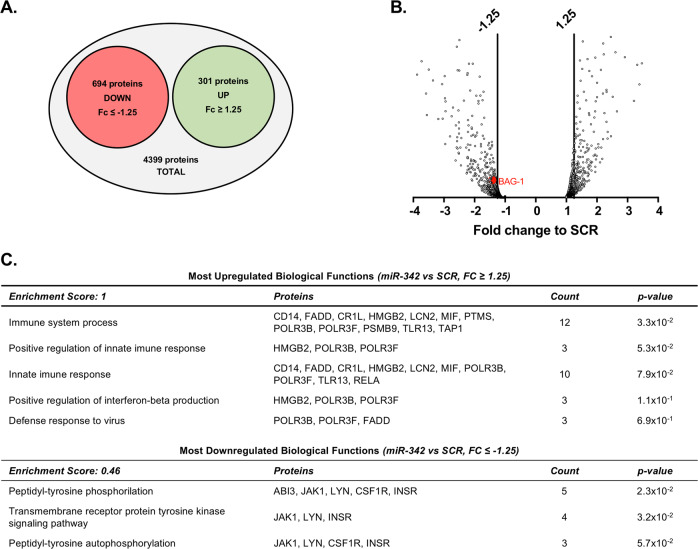
Fig. 5. Protein expression profile of miR-342-transfected microglia.
Protein identification and quantitation was performed by nano LC-MS/MS. Diagram a and volcano plot b represent the most differently expressed proteins within all identified proteins (−1.25 ≤ FC to SCR ≥ 1.25, n = 2). c Most up and downregulated biological functions based on protein expression fold change between miR-342 and SCR. Analysis was performed with DAVID using Functional Annotation Tool. The entire list proteins detected was used as background. “Enrichment score” indicates the biological relevance of the group of proteins involved in the respective set of biological functions, based on the p values of all enriched annotation terms. “Count” indicates the number of dysregulated proteins involved in that specific biological function. Full protein names can be found in Supplementary Table 4.

