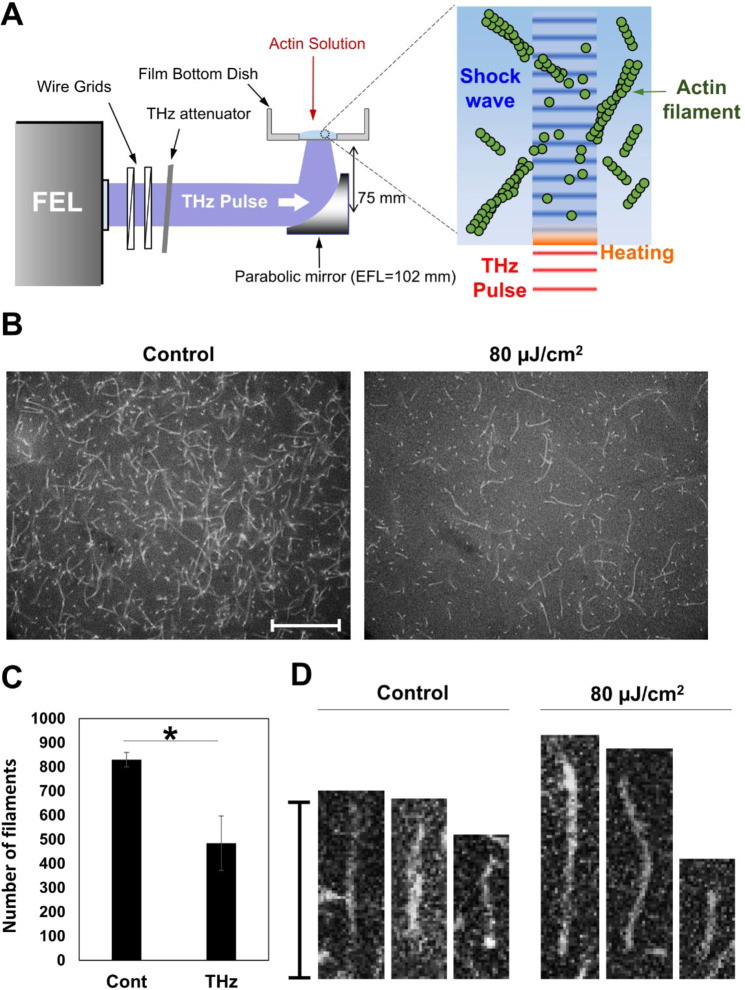
Figure 1.
Actin polymerization affected by THz irradiation in an aqueous solution. (A) Schematic diagram of the experimental set-up. Actin solution was placed in a film bottom dish. THz waves (4 THz) were applied to the bottom of the dish. After THz irradiation, a portion of the actin solution was collected for fluorescence microscope observation. (B) Fluorescence microscopy images of actin filaments with (control, left) or without THz irradiation (80 µJ/cm2, right). Actin solution (2.4 µM) was fixed and stained with SiR-actin after polymerizing for 30 min. (C) The number of actin filaments counted from fluorescence images. Data shown are the mean and the standard deviation of three independent experiments. More than 300 actin filaments were counted in each of the experiments. Asterisk indicate a statistically significant difference (*P < 0.05). (D) Magnified images of single actin filaments. The bar shows a scale of 20 µm.

