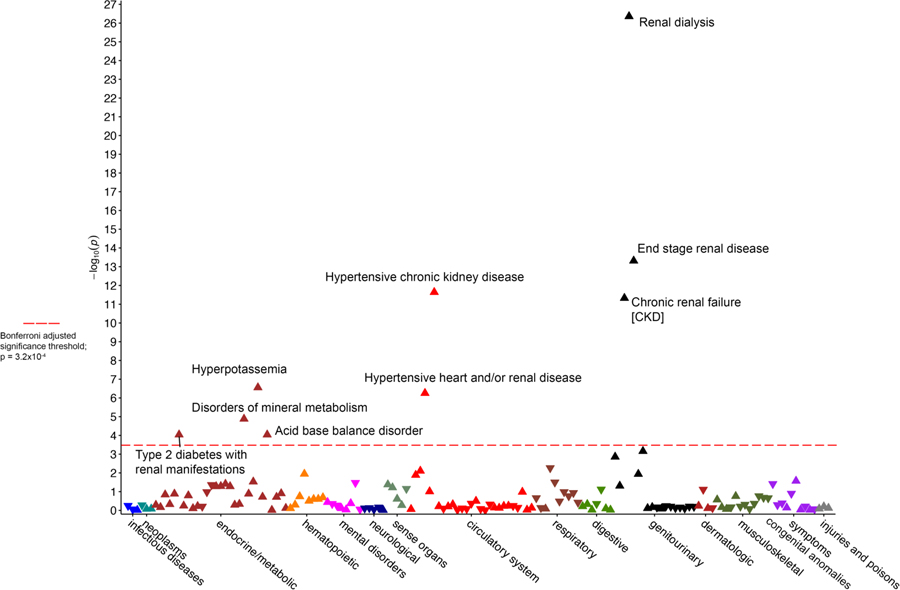
Figure 1.

Manhattan plot for phenome-wide association study data of the APOL1 high-risk genotypes in the Penn Medicine Biobank. Red horizontal line designates minimum p value for statistical significance after correction for multiple testing (p=2.2×10⁻⁴)
