
Figure 6:
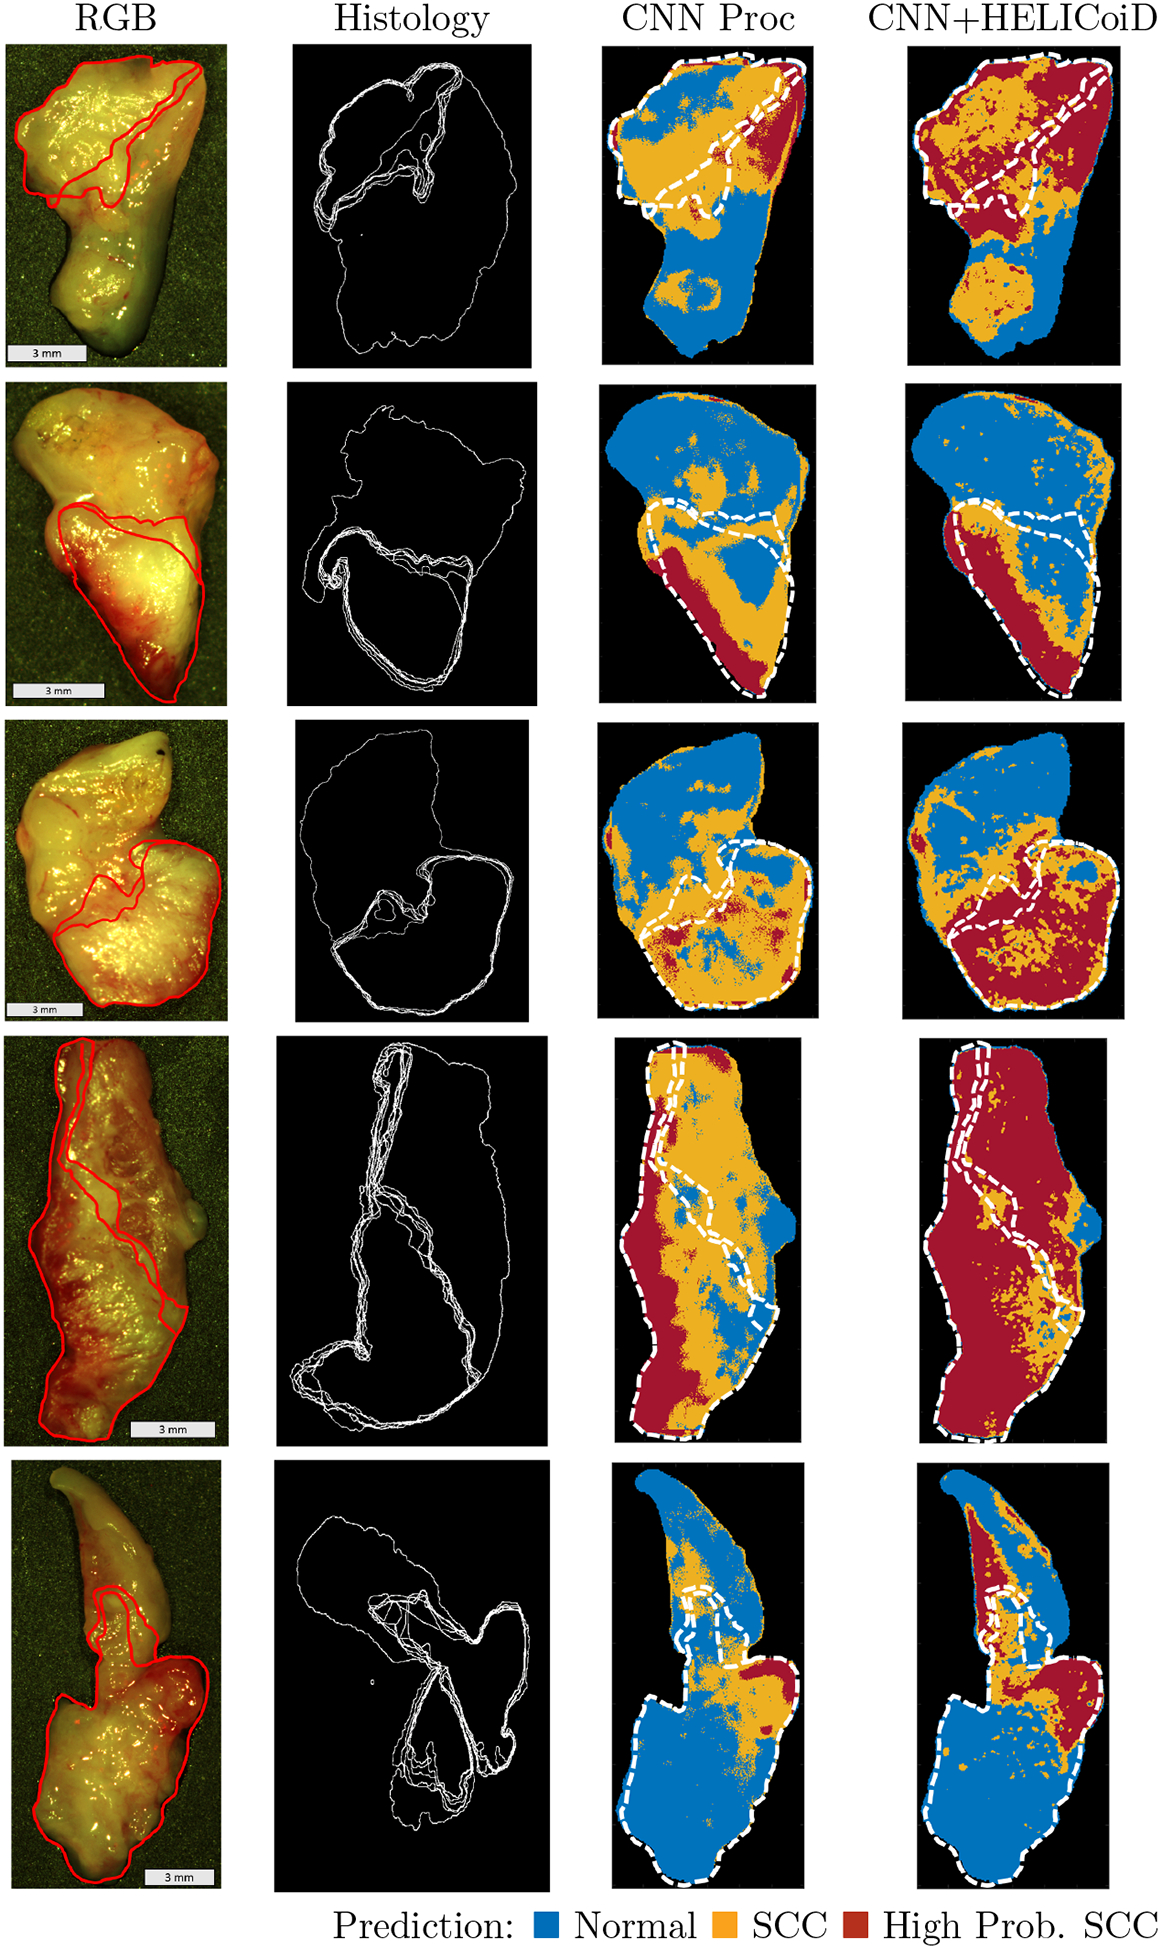
Representative results of binary cancer classification of the 5 testing patients. From left to right: HSI-RGB composite; histological ground truth showing variation in cancer margins with cancer area outlined; heat maps for cancer probability generated in two ways: 1. the CNN with pre-processed input alone, and 2. the method of additional HELICoiD+KNN filtering of the pre-processed CNN-generated probability maps. The extremes in the superficial cancer margin are overlaid on to the heat maps.