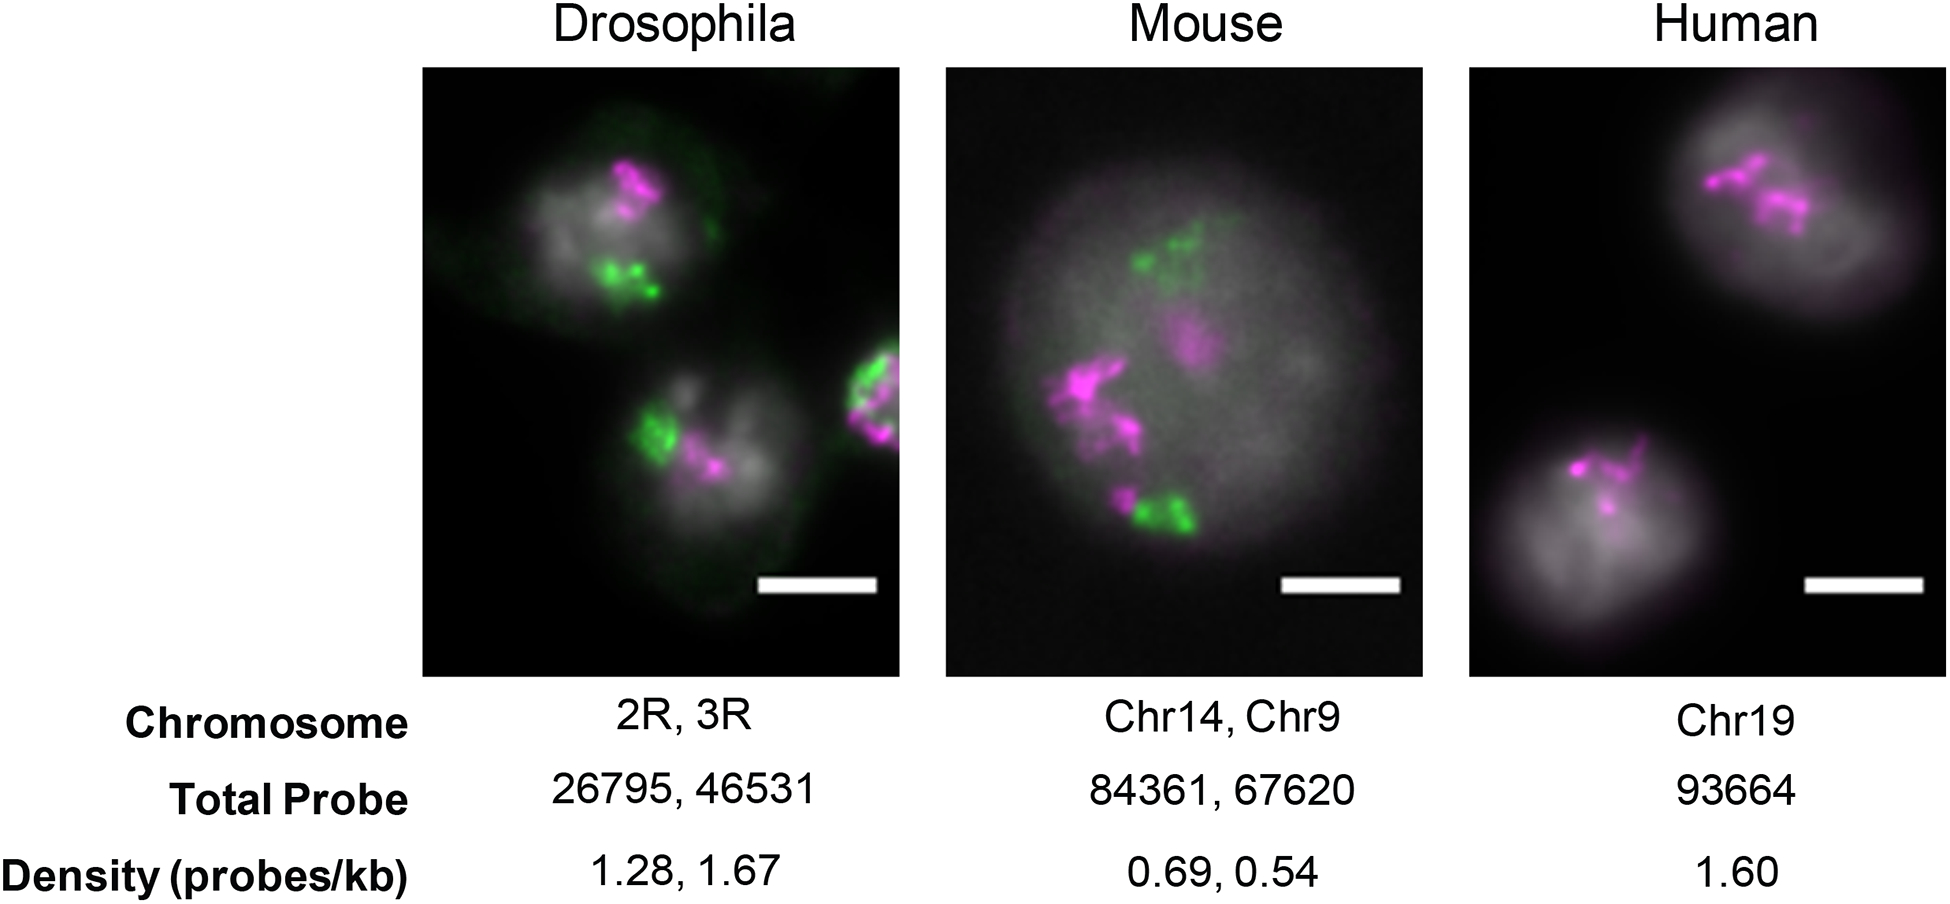
Fig. 1.

Representative images from a single z-slice of chromosome territories in Drosophila (Kc167 cells), mouse (3T3 cells), and human (HCT-116 cells) interphase nuclei. Chromosome target, total probe count, and average density of probe labeling across each chromosome are given. Scale bar, 5 μm.
