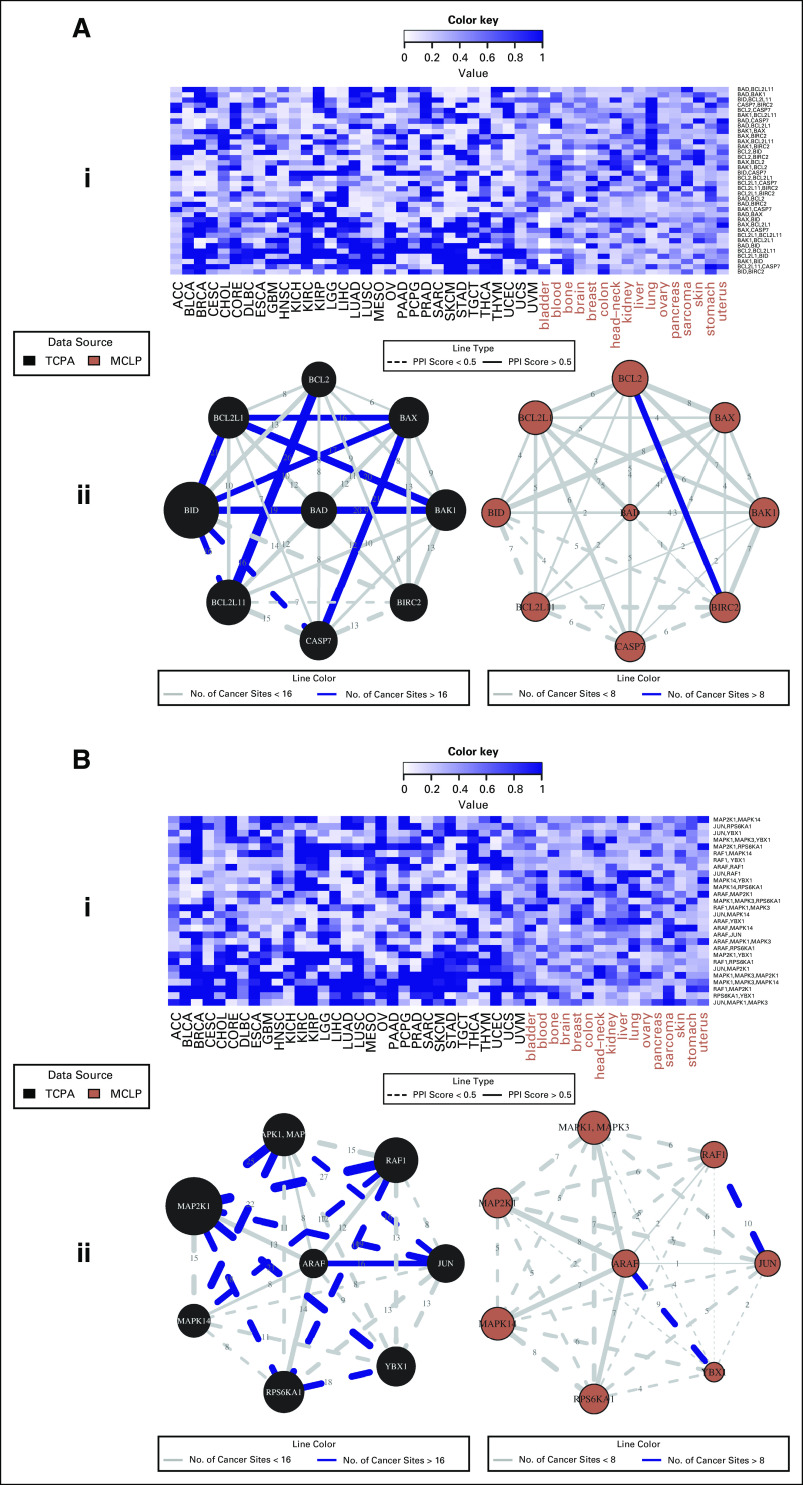
FIG 2.
Pan-cancer summary of protein networks for apoptosis (A) and RAS/MAPK (B) pathways. i. Heatmap depicting strengths of all possible protein-protein edges within the pathway, across all 47 patient and cell line tumor lineages, quantified by the posterior inclusion probabilities of the edges based on the fitted Bayesian graphical regression model. ii. Networks depicting pan-cancer commonalities and differences in cancer-specific network structures: edges are weighted by the edge consistencies, which are quantified by the number of patient tumor types holding that particular edge with a posterior probability (PPI) >0.5, and labeled by solid lines if the edges are confirmed by the interaction scores from STRING database. The left and right panels are networks for patients and cell lines, respectively. MCLP, MD Anderson Cell Lines Project; TCPA, the Cancer Proteome Atlas.

