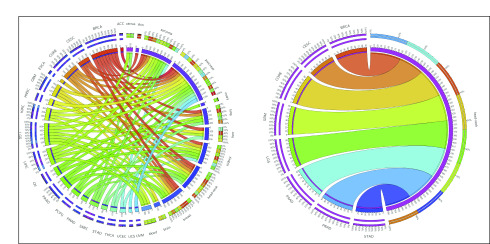
FIG 4.
Circos plots summarizing high correlations of network aberration scores between patient and cell line cancers. (A) An edge exists between a patient cancer type and a cell line cancer lineage if more than 75% of all possible patient-cell line pairs for that pair of cancers have a Pearson correlation of magnitude 0.9 or higher between their sets of the 12 pathway network aberration scores (sum of TransPRECISE sample-specific pathway activation and suppression scores). The edge strengths are determined by these percentages, as well. The edge colors indicate the patient cancers from which the edge originates, and the lengths of the innermost node pieces indicate the neighborhood size of the corresponding node. The two circular axes in the exterior indicate relative strengths of the edges originating from the same node, and the sections are colored by the opposite node to which that edge is connected, with the edges now arranged according to decreasing order of strength. (B) This panel contains the subset of the plot in Panel A with only the connections originating from the head and neck cell line type visible.

