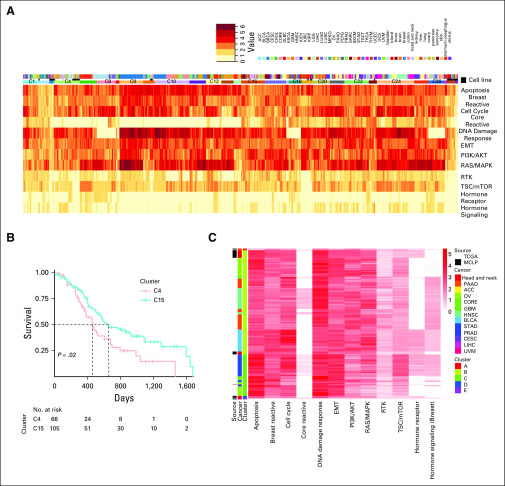
FIG 5.
Avatar cell lines identification and selection of driving pathways using network aberration scores. (A) Heatmap depicting network aberration scores (combined activation and suppression TransPRECISE pathway scores) after running unsupervised hierarchical clustering of the score matrix consisting of 8,354 samples (7,714 patients across 31 cancer lineages and 640 cell lines across 16 cancer types) and 12 proteomic signaling pathways. Twenty-nine clusters are identified by gap statistic. Out of the three annotation bars, the topmost one indicates tumor types, the middle one indicates whether the sample is a patient or a cell line, and the bottom one indicates cluster participation according to which the samples are grouped. (B) Kaplan-Meier curves depicting difference between survival times of patients with head and neck squamous cell cancer grouped in clusters C4 and C15 using the hierarchical clustering method on TransPRECISE network aberration scores. (C) Heatmap depicting network aberration scores (combined activation and suppression TransPRECISE pathway scores) after running unsupervised hierarchical clustering of the score matrix consisting of all patient samples and only the head and neck cell line samples across the 12 pathways. Out of the three annotation bars, the leftmost one indicates whether the sample is a patient or a cell line, the middle one indicates the cancer type, and the rightmost one indicates cluster participation according to which the samples are grouped.

