
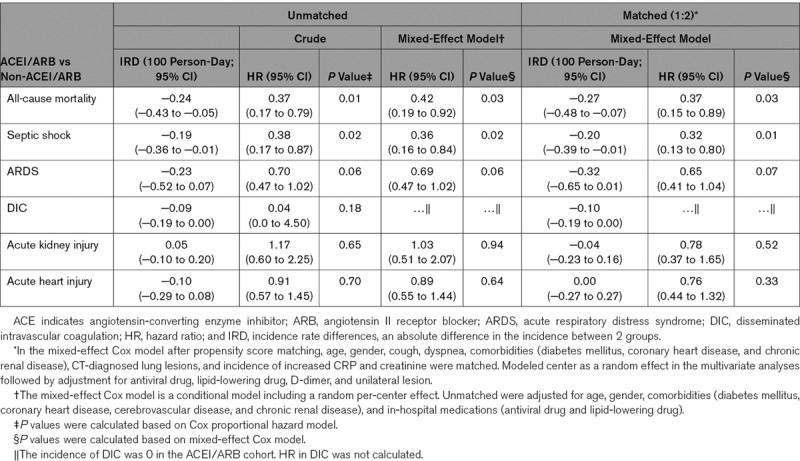
Table 3.
Hazard Ratios and Incidence Rate Ratios for Outcomes in ACEI/ARB Group vs Non-ACEI/ARB Group Under Mixed-Effect Cox Model and Propensity Score-Matching Model
Official websites use .gov
A
.gov website belongs to an official
government organization in the United States.
Secure .gov websites use HTTPS
A lock (
) or https:// means you've safely
connected to the .gov website. Share sensitive
information only on official, secure websites.
Hazard Ratios and Incidence Rate Ratios for Outcomes in ACEI/ARB Group vs Non-ACEI/ARB Group Under Mixed-Effect Cox Model and Propensity Score-Matching Model