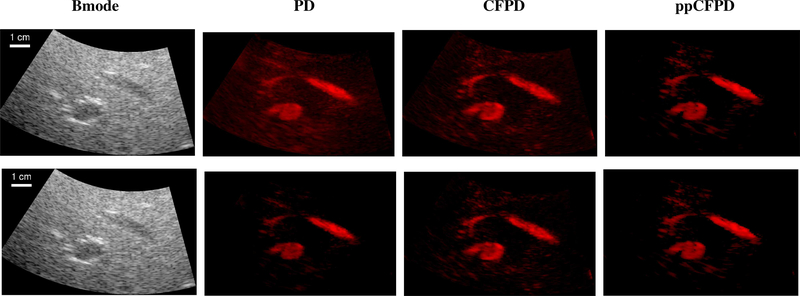
Fig. 13:
Preliminary images of liver blood flow to demonstrate in vivo feasibility. Bmode images shown on a 60 dB scale. Top Row: PD, CFPD, and ppCFPD images displayed on a 27 dB scale. Images produced via the ppCFPD algorithm effectively delineated small vessels, which are nearly indistinguishable from the noise floor in the PD case.
Bottom Row: The dynamic range is scaled to just above the perceptible noise floor for each image. The dynamic range is 21 dB for PD, 25 dB for CFPD, and 27 dB for ppCFPD. Decreasing the dynamic range compromises the visibility of low-intensity vasculature in PD relative to ppCFPD and CFPD.

