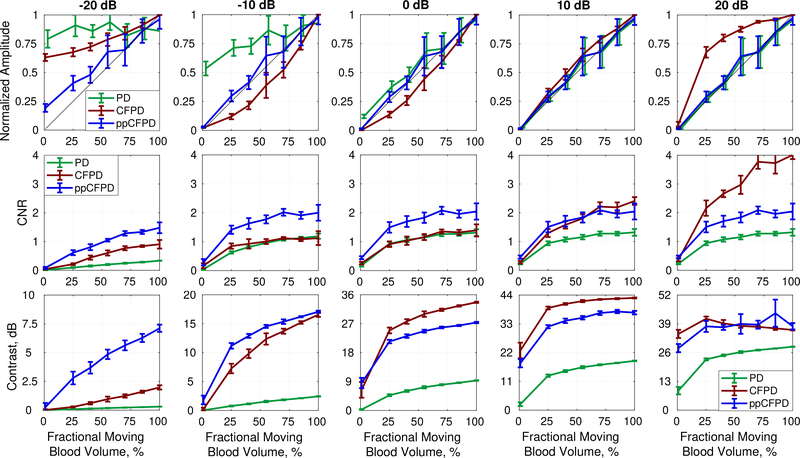
Fig. 4:
Plots depict the mean and standard deviation of image quality metrics measured across simulation realizations.
Top Row: The ppCFPD blood signal amplitude remains a linear approximation of the fractional moving blood volume despite variation in the blood channel signal-to-noise ratio (SNR) from −20 dB to 20 dB. This may be observed in the figure, as the ppCFPD curve closely approximates the theoretical value, shown in black. Center Row: The CNR of ppCFPD remained nearly constant across noise levels indicating effective suppression of the noise floor relative to the blood signal. Bottom Row: For all noise cases, ppCFPD and CFPD offered greater contrast than conventional PD.

