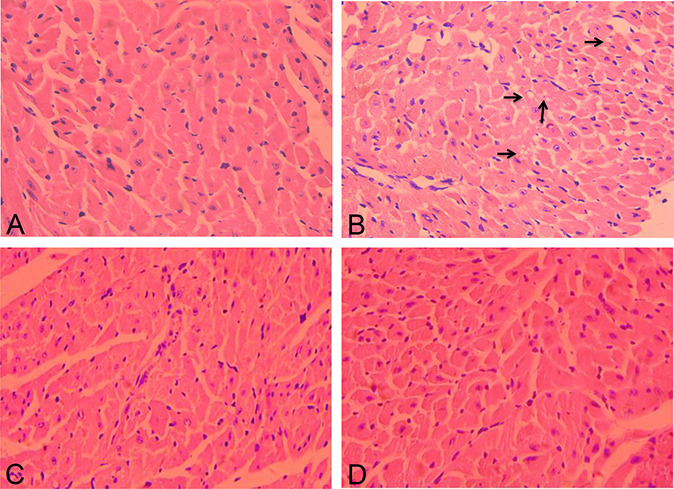
FIGURE 3.

The pathological structure indicated by hematoxylin and eosin staining in control and different treatment groups (hematoxylin and eosin, ×200) (n = 3). A, Normal myocardial architecture of control group. (B) The DOX group showed vacuoles sarcoplasm, fragmentation, and degeneration of the myofibrillar, nuclei fade and detachment. (C) The latifolin (50 mg/kg) group showed mild degeneration of myocardial tissues; (D) the latifolin (100 mg/kg) group showed well-organized cardiac myofibers and nuclei profile.
