FIGURE 7.
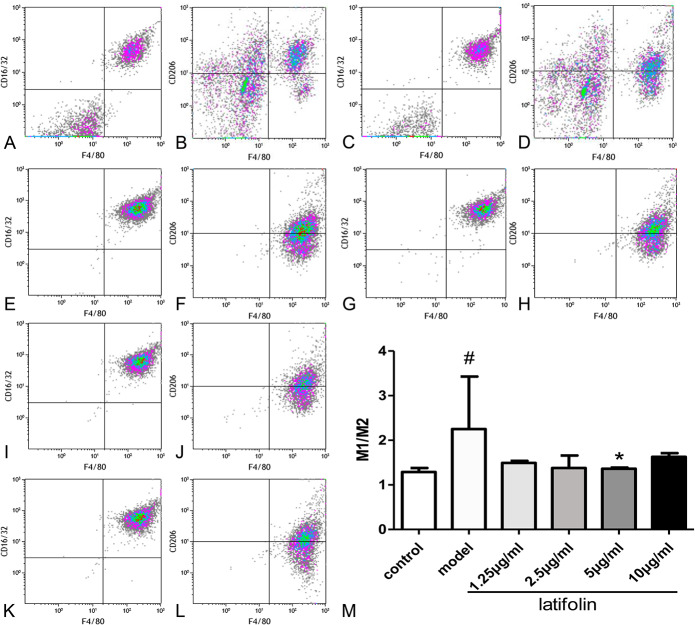
The effect of latifolin on the M1 and M2 polarization of peritoneal macrophages. Latifolin decreased the M1:M2 ratio on the concentration of 5 μg/mL. A, M1 polarization of control group; (B) M2 polarization of control group; (C) M1 polarization of model group; (D) M2 polarization of model group; (E) M1 polarization of 10 μg/mL group; (F) M2 polarization of 10 μg/mL group; (G) M1 polarization of 5 μg/mL group; (H) M2 polarization of 5 μg/mL group; (I) M1 polarization of 2.5 μg/mL group; (J) M2 polarization of 2.5 μg/mL group; (K) M1 polarization of 1.25 μg/mL group; (L) M2 polarization of 1.25 μg/mL group; (M) M1:M2 ratio. Data were shown as mean ± SD, n = 3. #P < 0.05, versus control, *P < 0.05, versus model group.

