
Fig. 11.4.
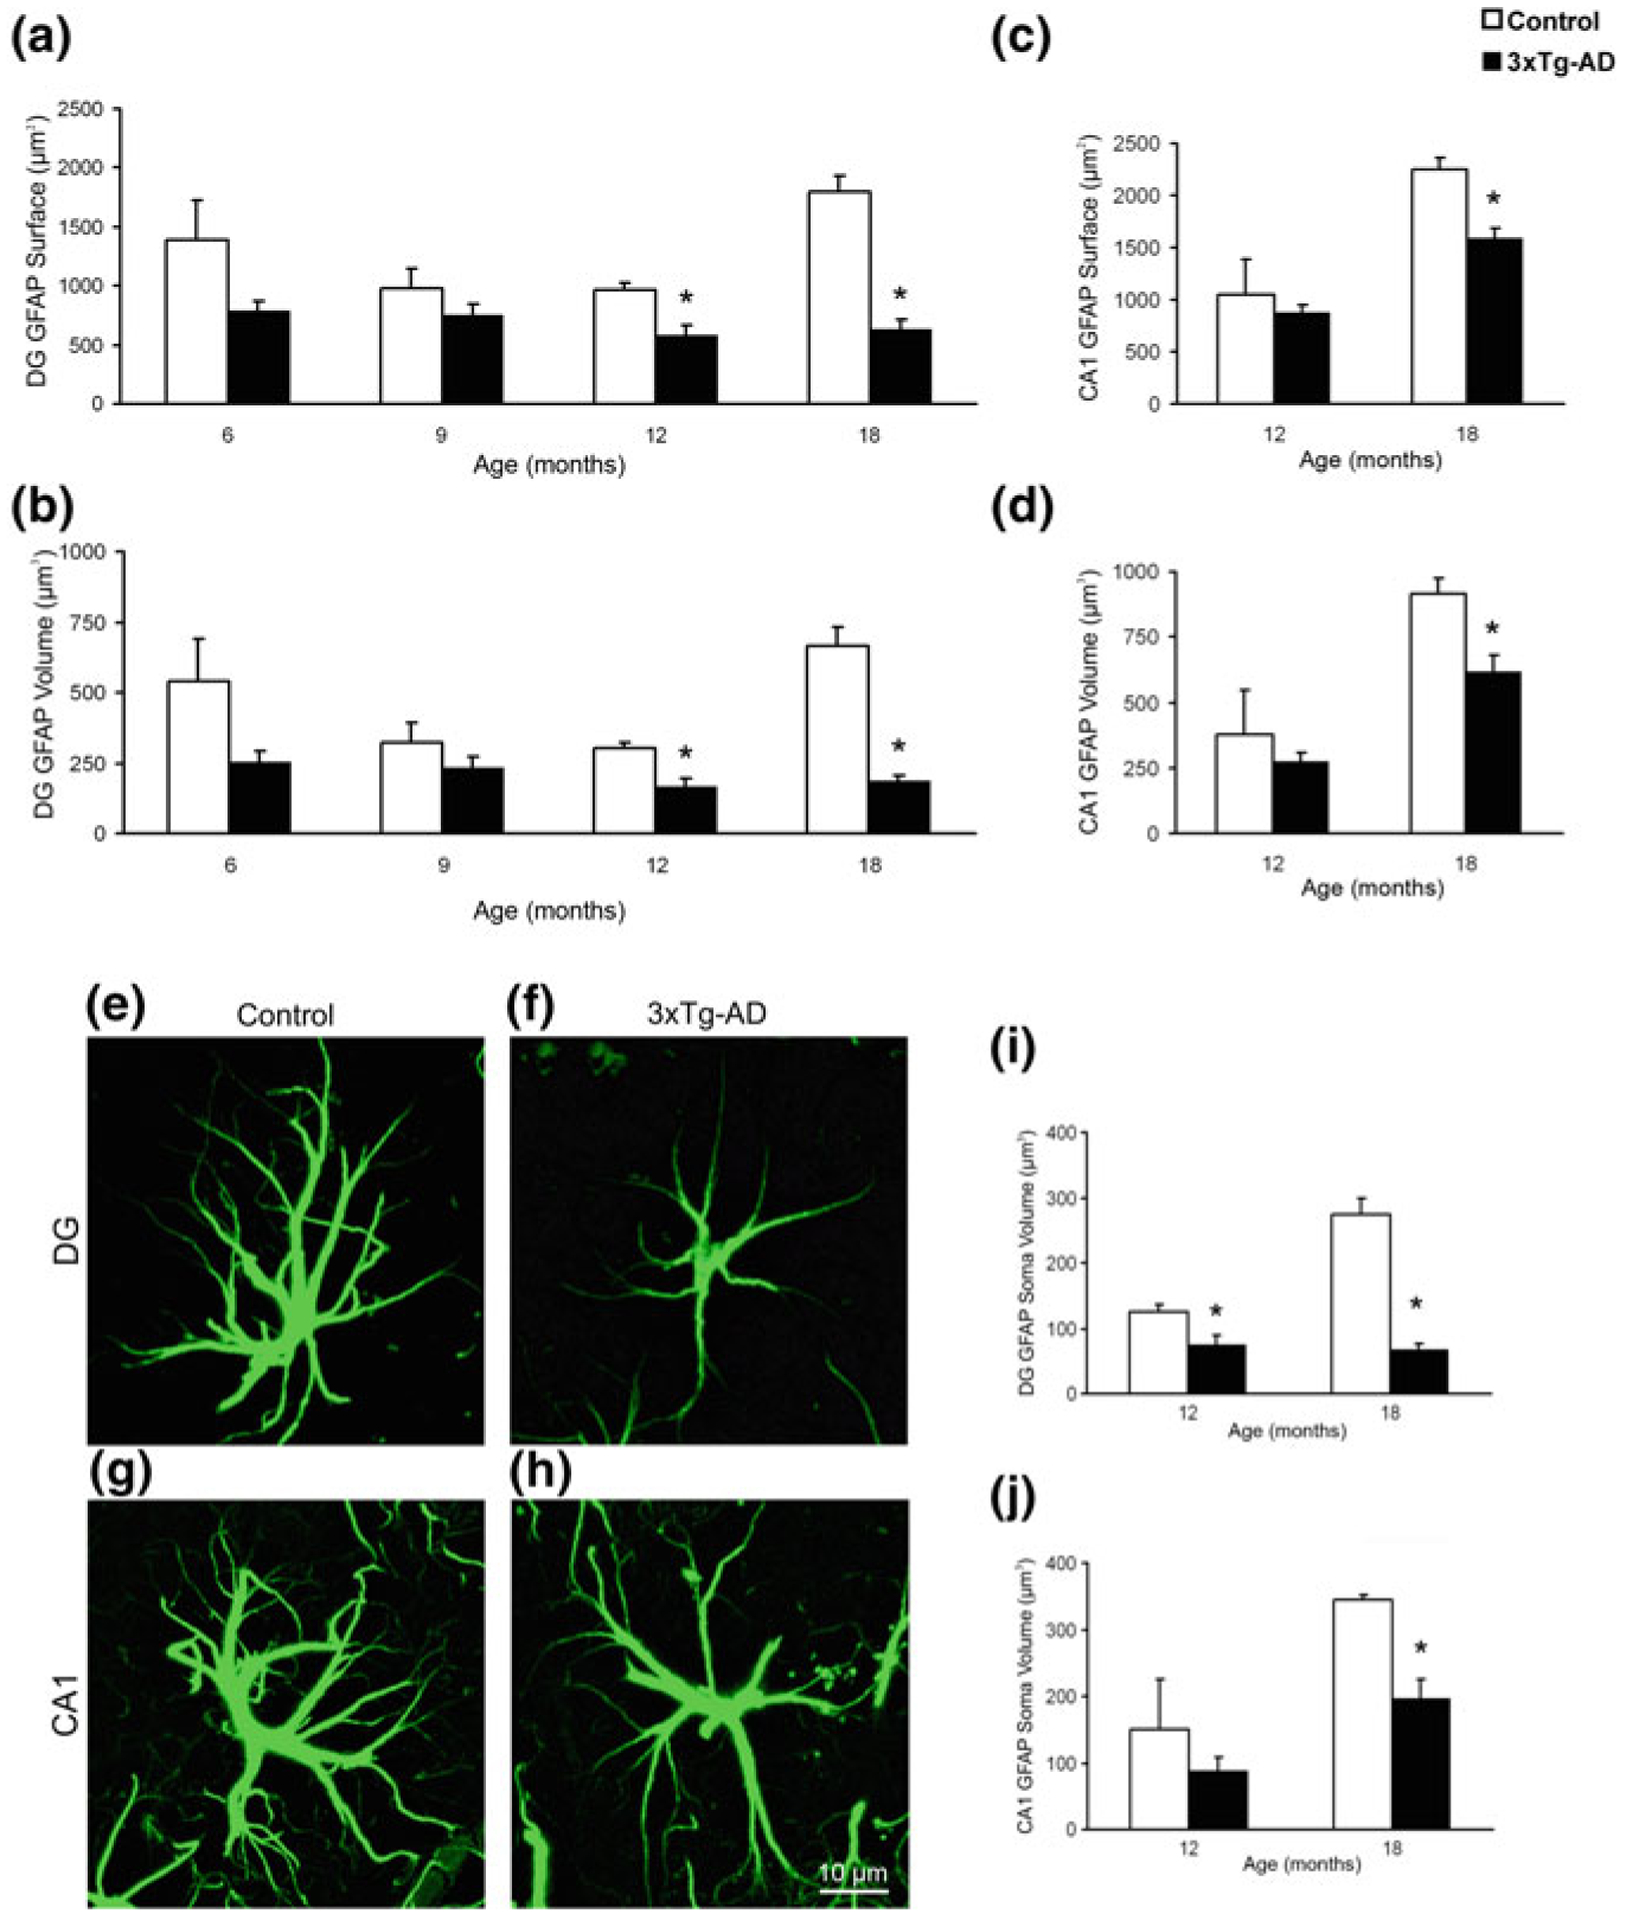
Astroglial atrophy in the hippocampal areas of 3xTg-AD mice. Bar graphs showing the significant decrease in surface area, volume, and soma volume of GFAP-positive astrocytes in the dentate gyrus (DG) (a, b, i) and the CA1 region (c, d, j) of the hippocampus of the 3xTg-AD mice when compared with control animals. Bars represent mean ± SEM (p < 0.05). (g–j). Confocal micrographs illustrating the astrocytic atrophy in 3xTg-AD mice in the DG (f) and CA1 (h) compared to control animals (e and g). Reproduced with permission from [203]