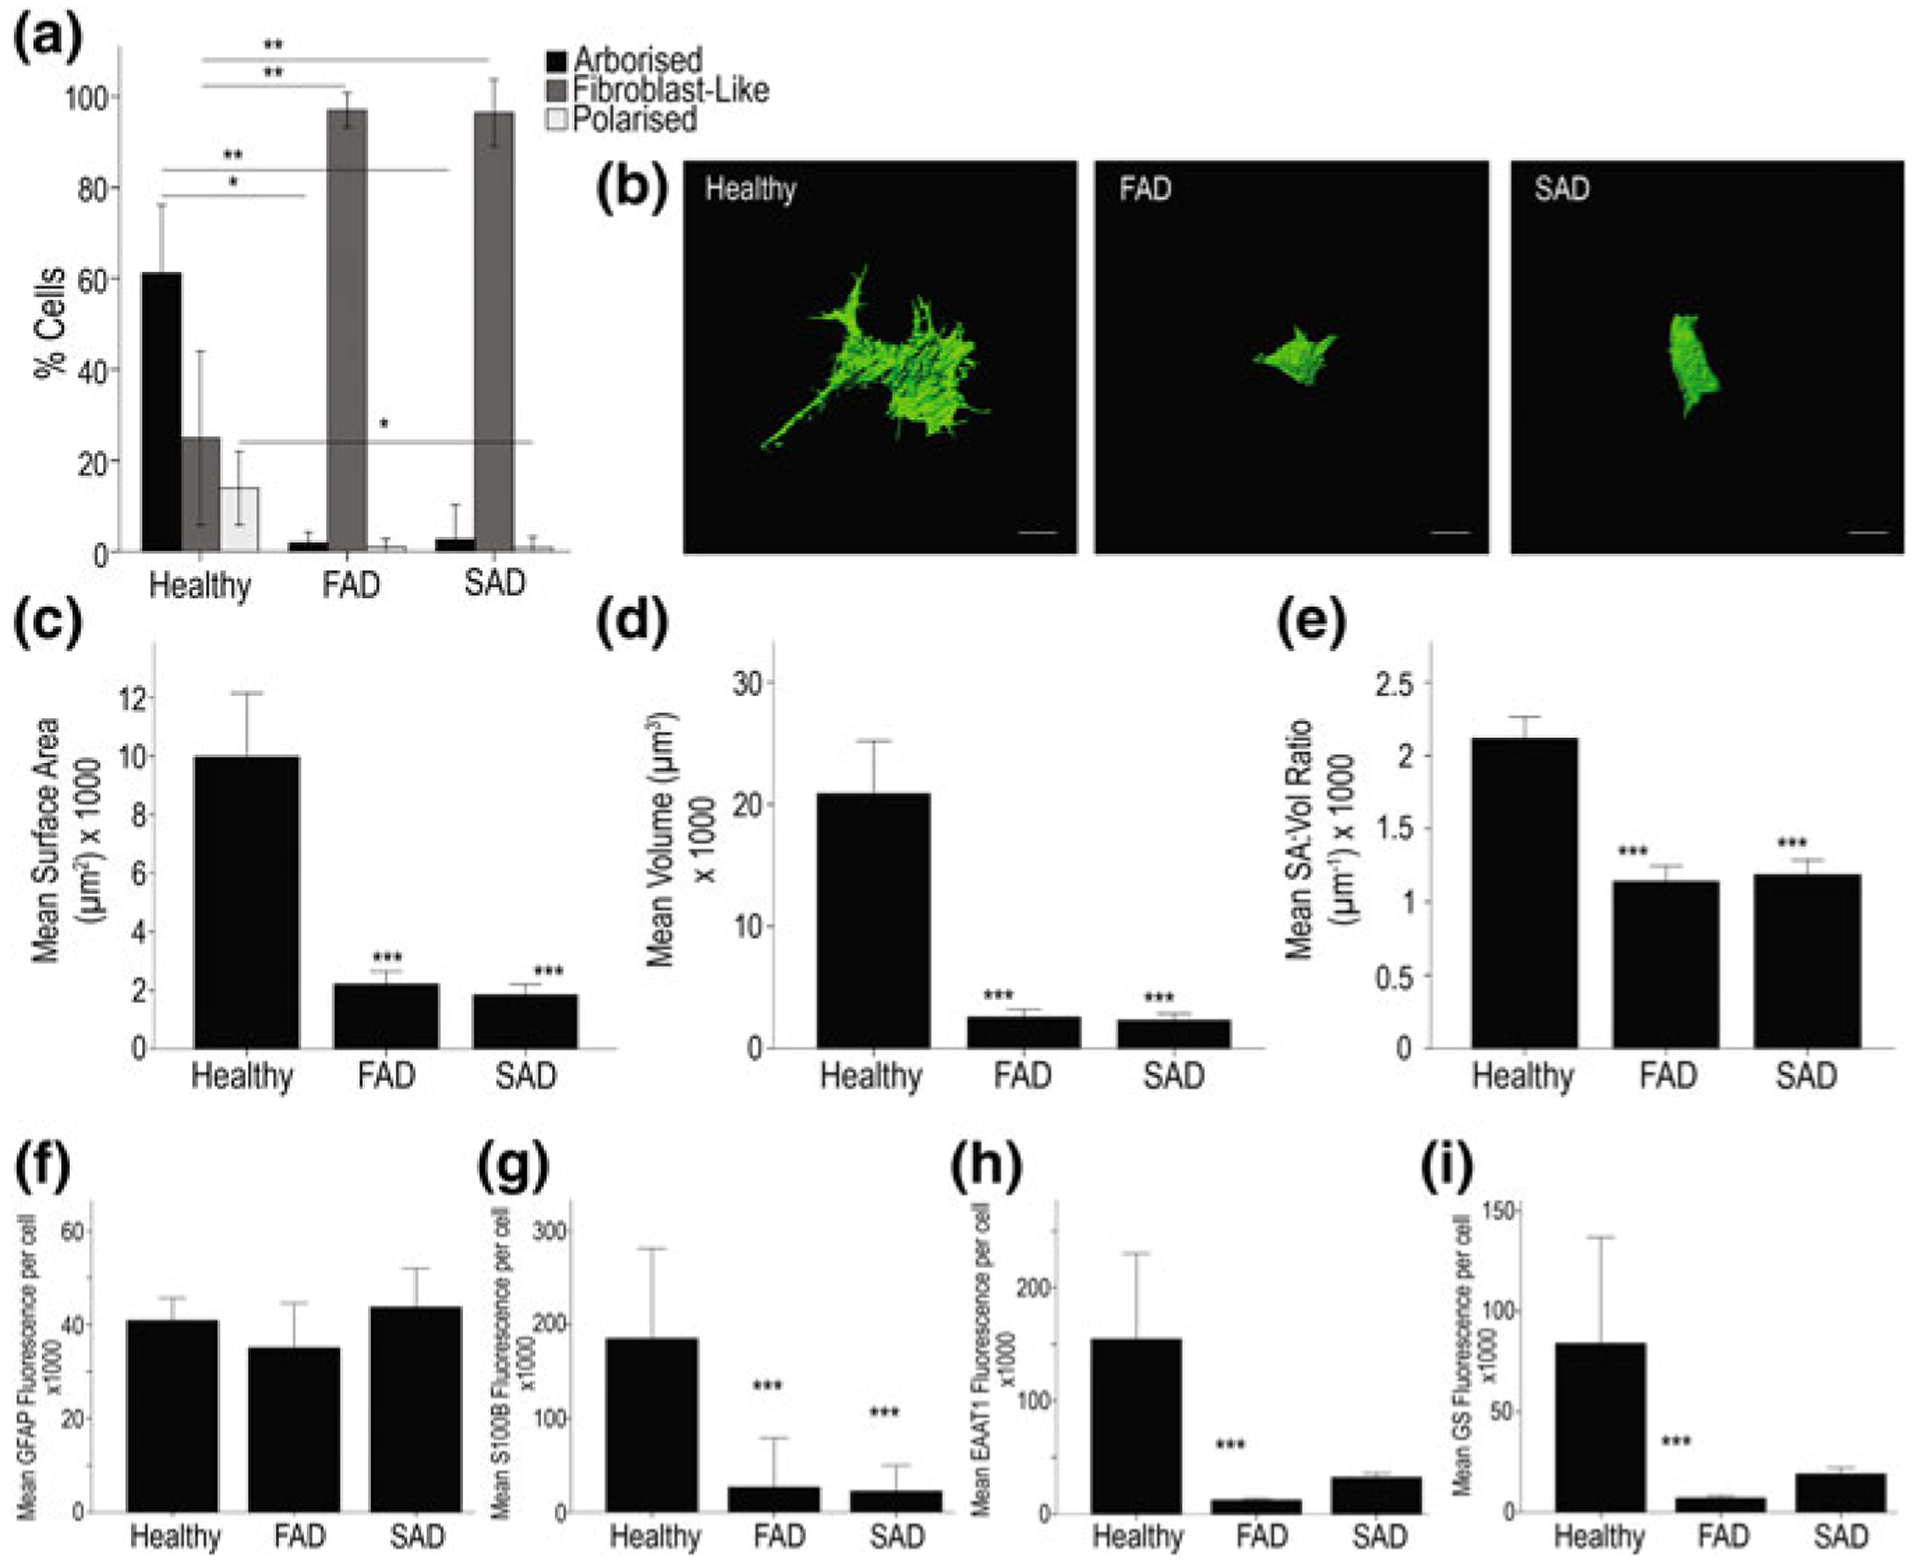
Fig. 11.5.

Astrocytes derived from PSEN1 M146L FAD and ApoE4+/+ SAD patients exhibit significant atrophy when compared to those from healthy patients. a Exemplar 3D isosurface renders constructed from serial confocal z-stacks display clear differences in cell size and overall morphology (b). Scale bar = 10 μm. Quantification of cells using these renders by way of surface area (c), cell volume (d) and SA:Vol ratio (e) reveal significant differences in all aspects of cellular morphology between healthy and diseased astrocytes. Quantification of mean fluorescence intensity per immunoreactive cell reveals no significant difference in GFAP staining intensities between AD and control astrocytes (f) but S100B, EAAT1 and GS intensities are reduced in both FAD and SAD cells (g, h and i, respectively). Asterisks on graph; ***p < 0.001, **p < 0.005, *p < 0.05. Reproduced from [119]
