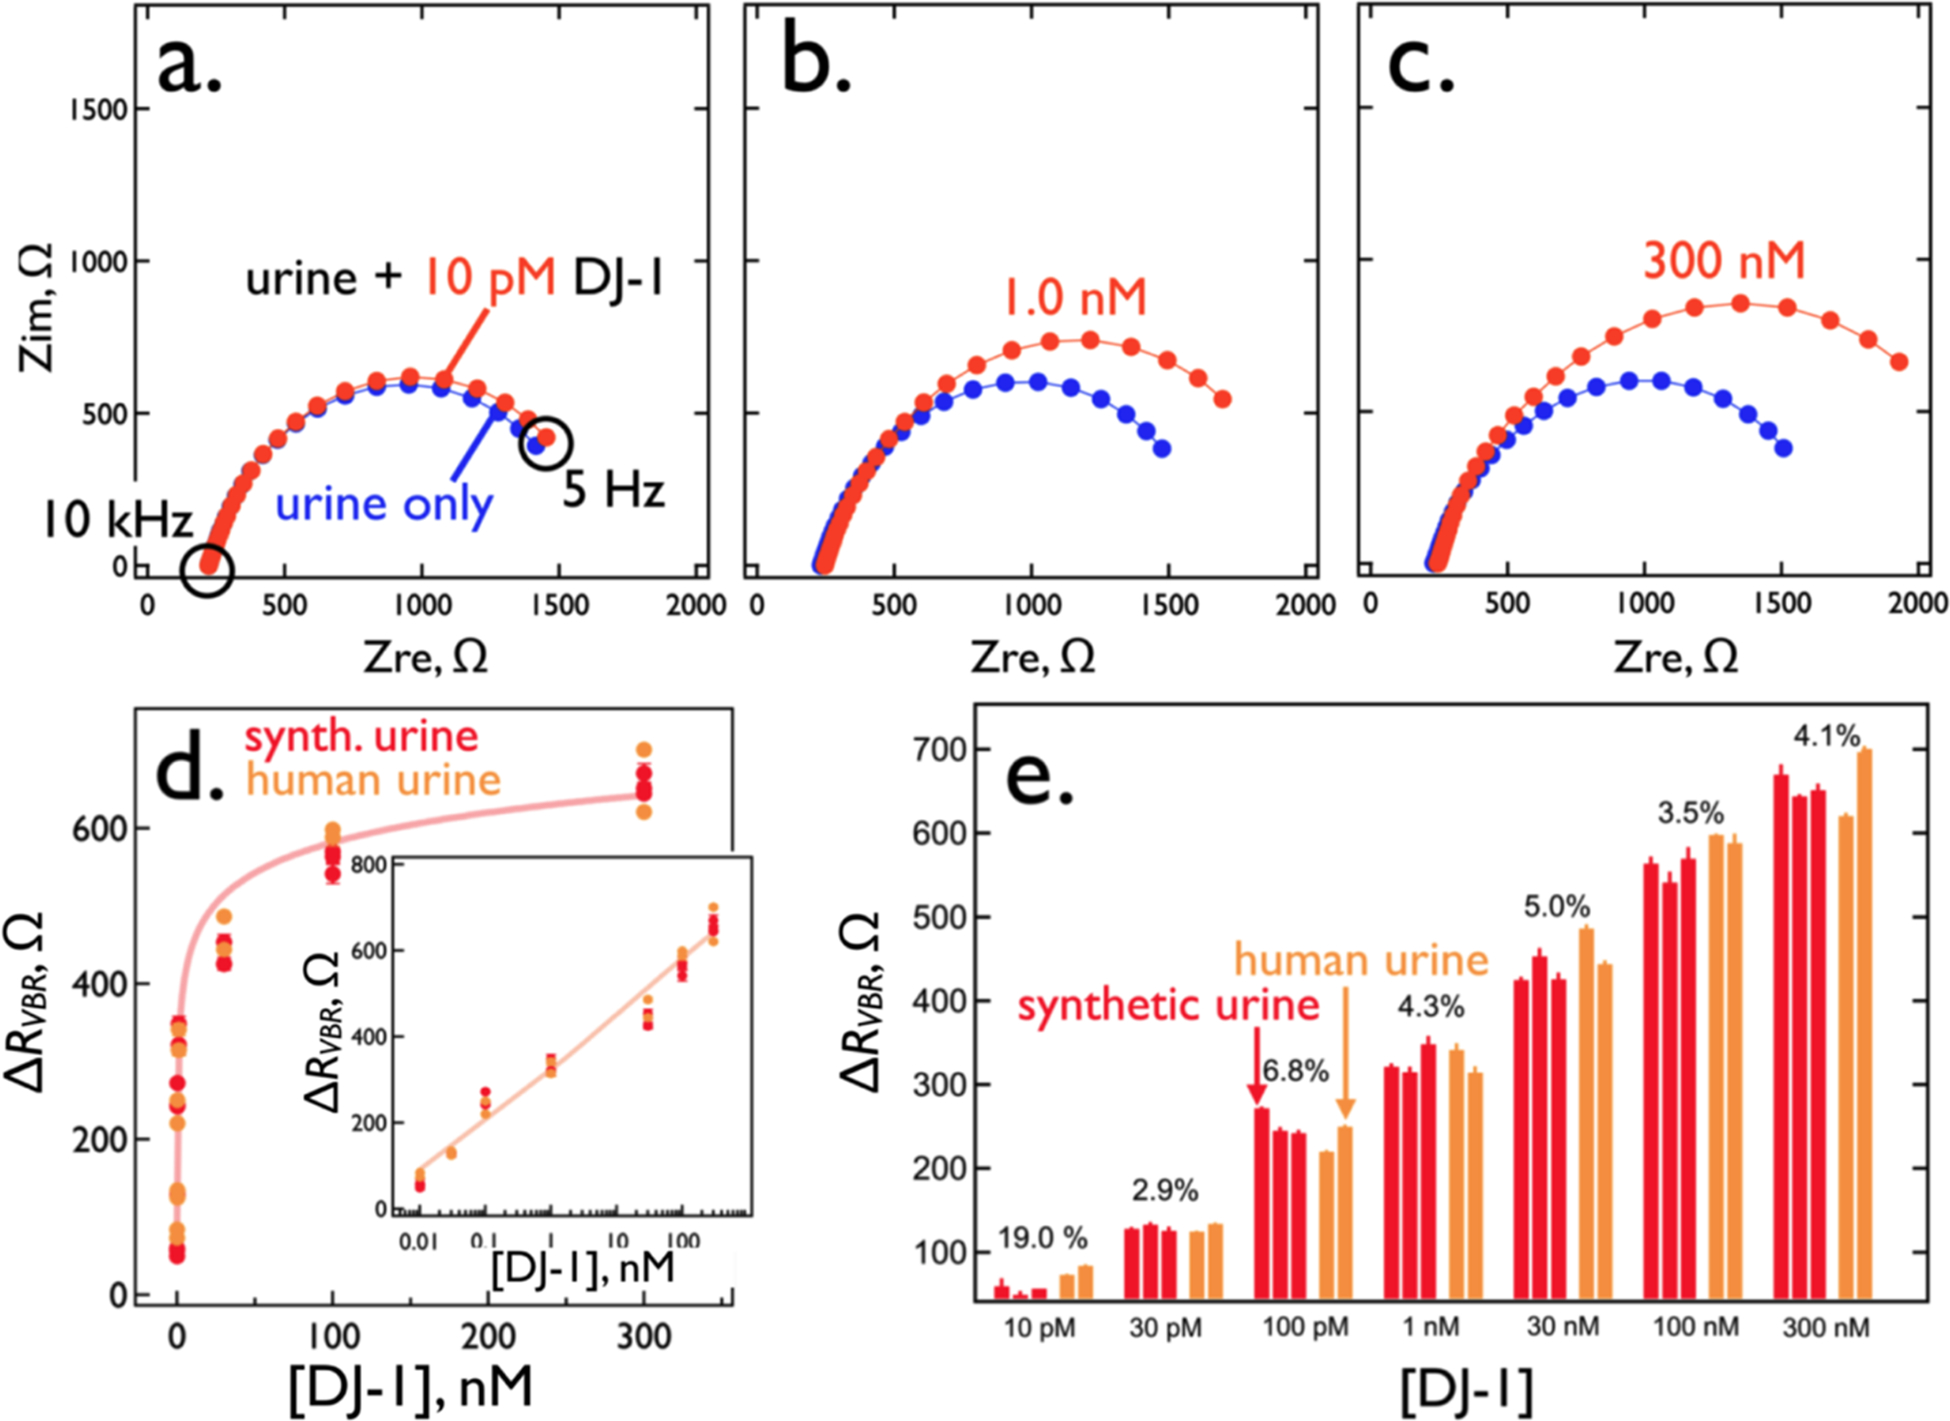
Figure 8.

DJ-1 sensing performance using VBRs with RPEDOT-PSS = 280 to 300 Ω. (a,b,c) Nyquist plots for three DJ-1 concentrations of (a) 10 pM, (b) 1 nM, and (c) 300 nM. Also shown (blue traces) are background Nyquist responses in synthetic urine only. (d) A calibration curve for the detection of DJ-1 using the RVBR signal constructed using 21 individual measurements from the same number of VBRs, at seven concentrations. Values of KD and h (the Hill exponent) obtained from a best fit of the experimental data to equation (2), are indicated. (e) Bar plot for ΔRVBR measurements acquired from 21 electrodes, illustrating the sensor-to-sensor reproducibility of these data. CoVs for these data, shown, are in the 2 to 8% range across four orders of magnitude in DJ-1 concentration. The values of each of the circuit elements is indicated in Table S1.
