
FIGURE 2.
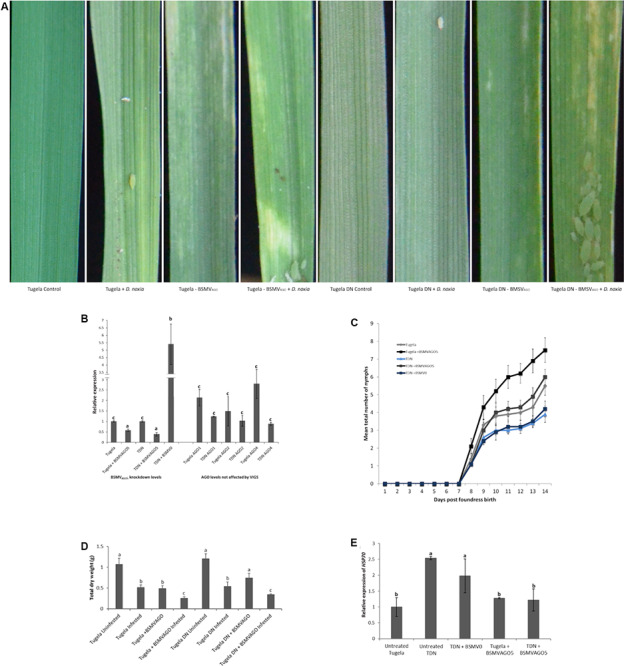
Knockdown of TaAGO5 using Barley stripe mosaic virus (BSMV)-mediated virus-induced gene silencing. (A) Phenotypic variation after different treatments observed 20 days after virus infection. The controls were untreated-uninoculated plants and displayed no lesions. Untreated-infested plants served as symptom controls, with Tugela plants showing longitudinal streaking and leaf rolling in contrast to only localized cell death observed for Tugela DN. Tugela and Tugela DN BSMVAGO plants displayed severe chlorotic streaking and leaf rolling characteristic of the susceptible phenotype. (B) Knockdown of TaAGO5 after BSMV infection of the plants. Both Tugela and Tugela DN (TDN) TaAGO1, 2, and 4 were evaluated for response to the silencing of TaAGO5. The Tugela DN empty vector control (BSMV0) showed high levels of induction. (C) Mean total aphid production of 10 plants per treatment over 14 days. Aphids feeding on Tugela DN displayed the lowest mean production of nymphs. In contrast, the aphid numbers were highest for Tugela DN and Tugela knockdown plants. (D) Total dry weight for the different plants after 14 days of feeding by D. noxia. Biomass was the highest in the untreated controls and lower for the infested plants. The knockdown of TaAGO5 in Tugela DN resulted in biomass lower than the infested controls. Treated and infested plants displayed the lowest biomass. (E) Expression analysis of HSP70 as measure of increased stress levels of D. noxia feeding on knockdown plants and controls. Increased levels were displayed on the resistant Tugela DN and the BSMV0 controls. The elevated levels for Tugela DN are in line with the antibiotic effect imparted by Dn1 on the cultivar. The observed elevated levels of HSP70 in the BSMV0 control indicated that the resistance response of the Tugela DN cultivar against D. noxia feeding was intact. Different letters indicate significant differences to the controls (p ≤ 0.05) as determined by ANOVA and Tukey’s HSD post hoc test.