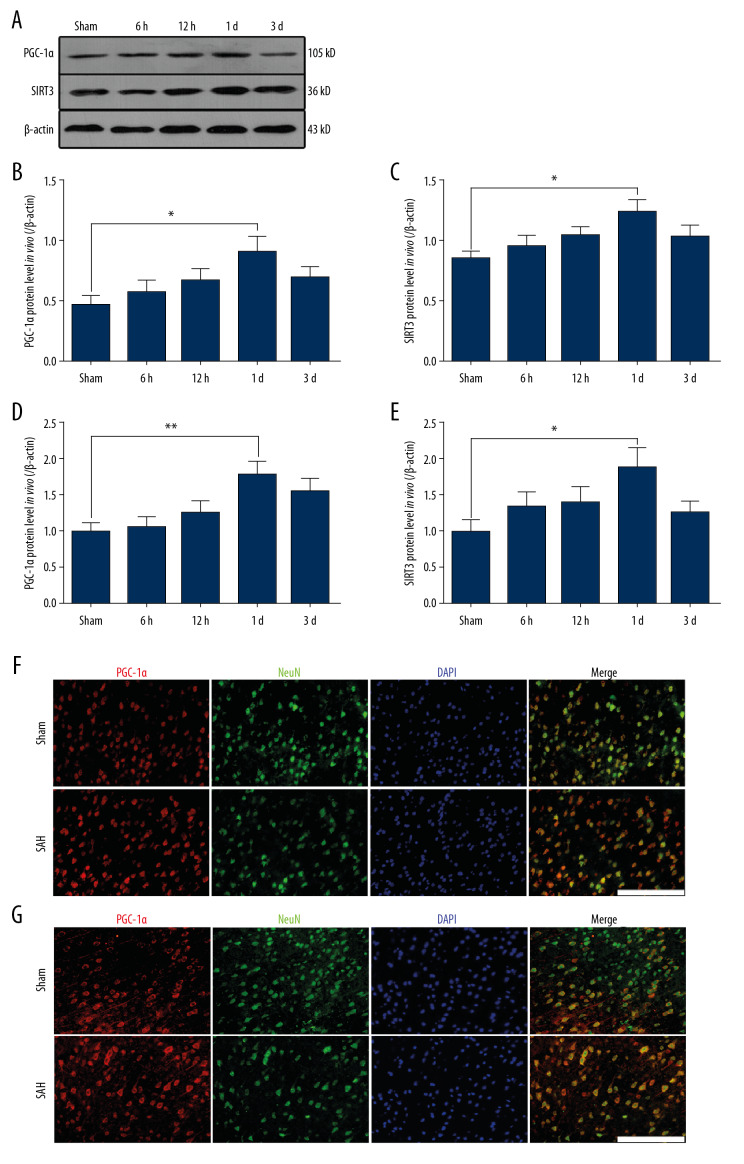
Figure 1.
The expression of PGC-1α/SIRT3 pathway in the cortex of mice following SAH. (A–C) the protein levels of PGC-1α and SIRT3 in different groups. (D, E) the mRNA levels of PGC-1α and SIRT3 in different groups. (F) Colocalization of PGC-1α and NeuN was revealed in different groups. (G) Colocalization of SIRT3 and NeuN was revealed in different groups. (* P<0.05; n=12/group; SAH group: 24 h after SAH model induced in vivo; Scale bar=25 μm).

