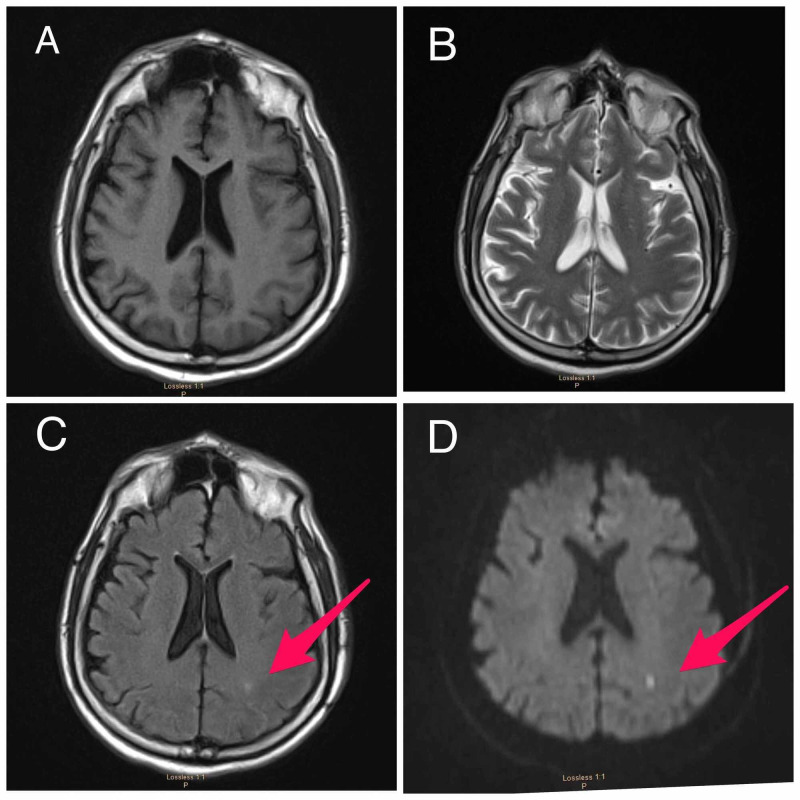
Figure 2. MRI of the brain.
(A) Normal T1-weighted, (B) normal T2-weighted, (C) FLAIR sequence shows increased signal in the area of the acute stroke (arrow) and (D) diffusion-weighted imaging shows an area of restricted diffusion in the left parietocoritcal region (arrow).
FLAIR, fluid attenuated inversion recovery.

