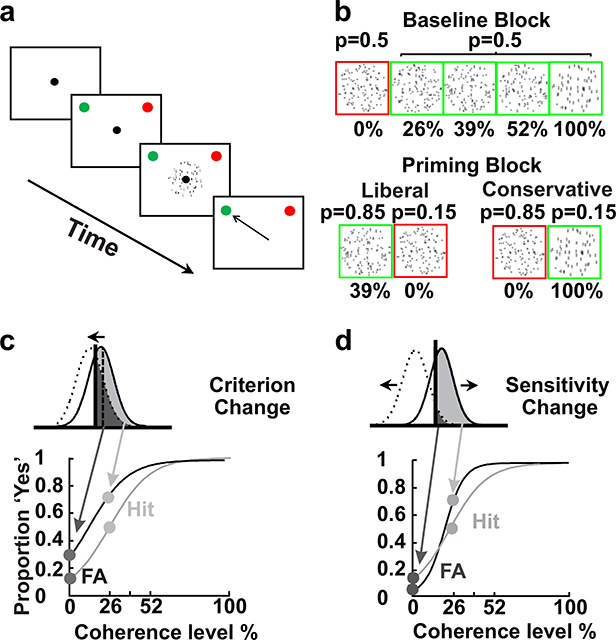
Figure 1. Psychophysics of a ‘Yes-No’ decision task and sensorimotor priming.
a, Schematic of the spatial arrangement of the task and the sequence of the task events. The black outlined squares show the monitor and the black circle shows the fixation spot. The red and green circles indicate the choice targets and note that they changed position randomly. The small, black arrow shows an example choice. b, Illustration of the task statistics. The no-structure stimulus was a Glass pattern with 0% coherence (red) and the structure stimuli were 26%, 39%, 52%, 100% coherent Glass patterns (green). The probability of occurrence of the no-structure and structure stimuli was equal (balanced block). P indicates the probability of stimulus occurrence. In the unbalanced block, either the 39% coherent stimulus occurred more often compared to the 0% (no-structure) stimulus (85:15; Liberal priming trials) or the no-structure stimulus occurred more often than the 100% stimulus (85:15; Conservative priming trials). c. Signal detection theory predictions and psychometric functions for changes in criterion. d. Signal detection theory predictions and psychometric functions for changes in sensitivity.

