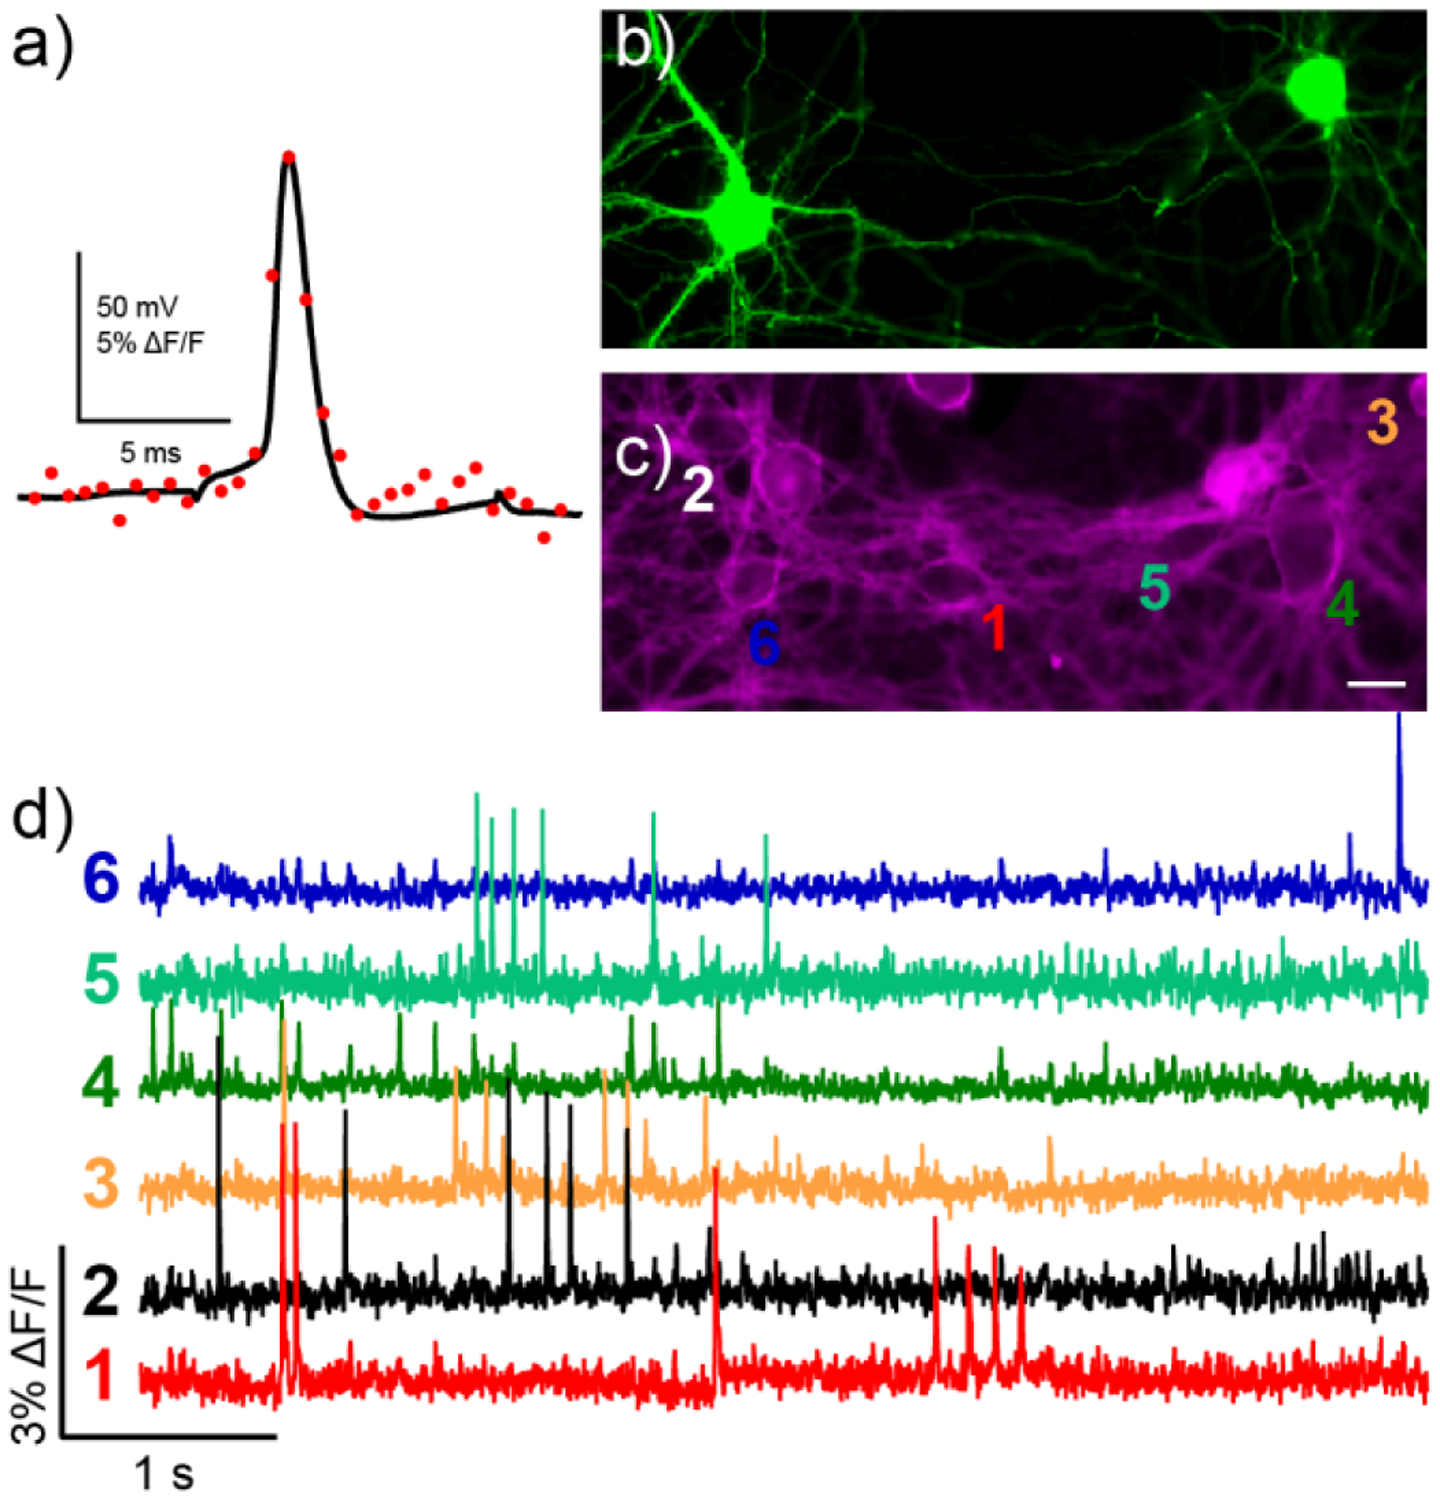
Figure 5.

Characterization of BeRST 1 in neurons. a) Dual electrical (black trace) and optical recording (red dots, 1.8 kHz frame rate) from a hippocampal neuron stained with BeRST 1 was subjected to whole-cell current clamp and stimulated to induce action potential firing. A small stimulus artifact is apparent before and after the action potential in the black trace. (b-d) Spontaneous voltage imaging in GFP-labeled cells with BeRST 1. Epifluorescence images of rat hippocampal neurons expressing b) GFP and c) stained with BeRST 1. Scale bar is 20 μm. d) Optical traces of spontaneous activity in neurons from panels (b) and (c). Numbers next to traces correspond to indicated cells in panel (c). Optical sampling rate is 500 Hz.
