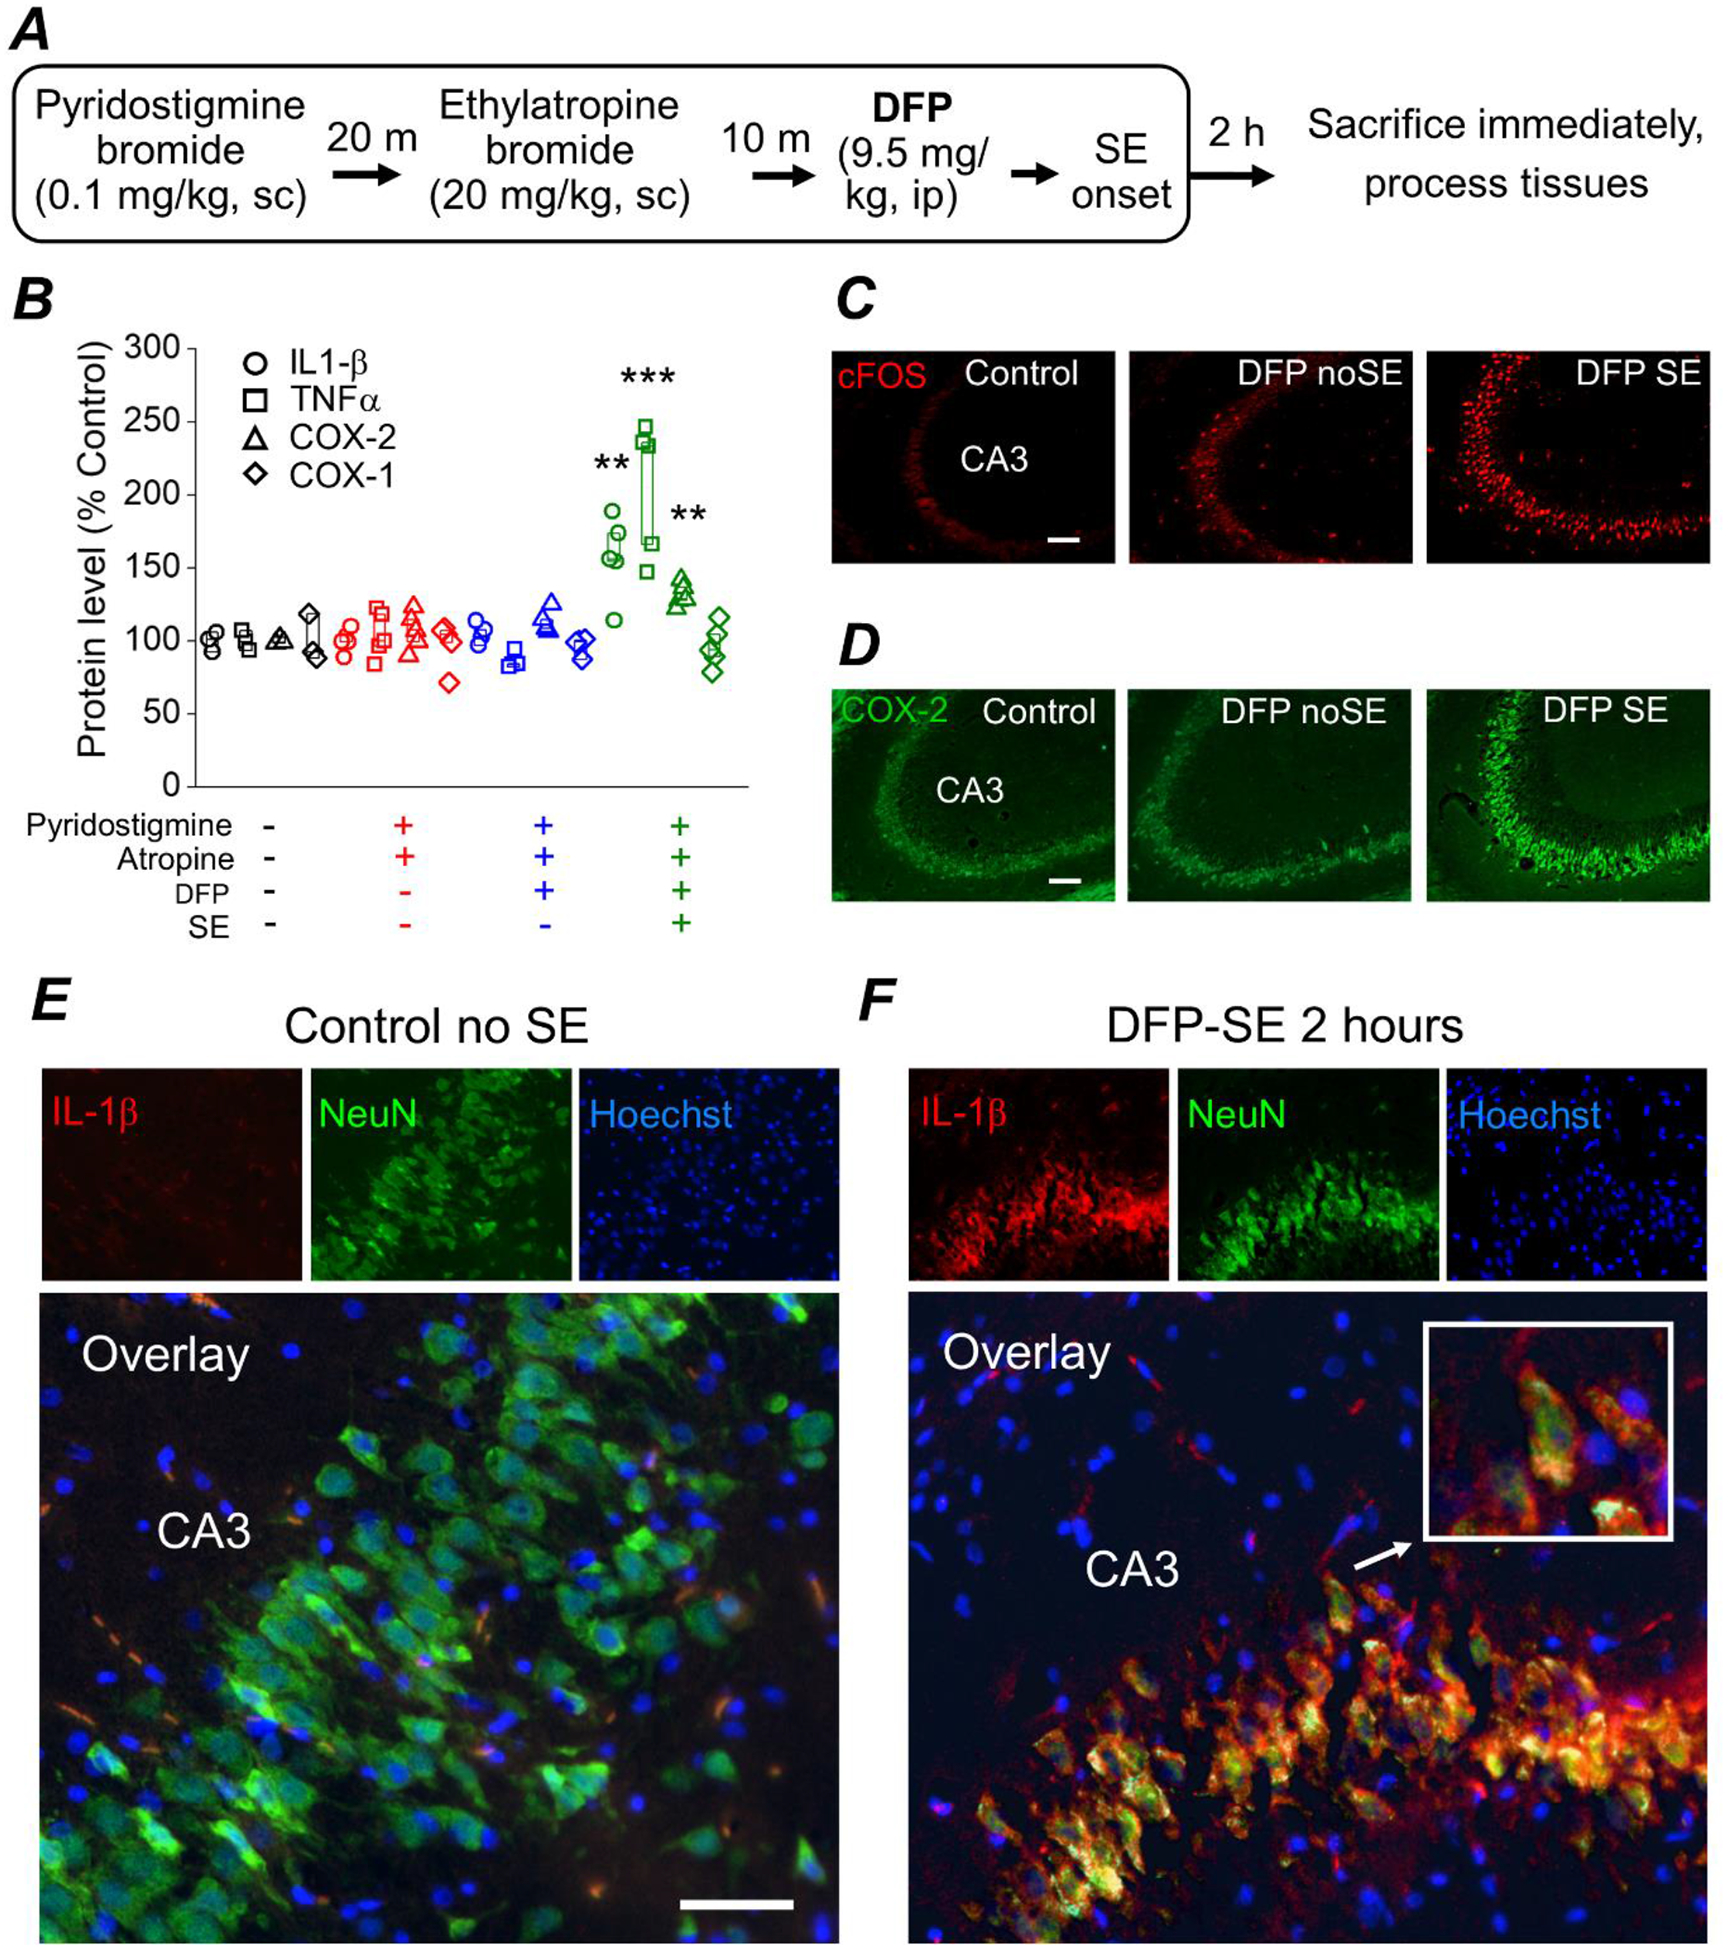
Figure 1. DFP-induced SE elicits an early inflammatory response and induction of cFos in the brain of rats.

A, experimental paradigm of chemical administration in a rat model of DFP-induced SE. All rats were administered pyridostigmine bromide and ethylatropine bromide followed by DFP to induce status epilepticus. After 2 h of SE all rats were immediately euthanized and the brains were removed and bisected longitudinally. One hemisphere was homogenized in RIPA lysis buffer to obtain protein lysates and the other hemisphere was cut on a crytostat to obtain coronal sections (40 μm) throughout the hippocampus for immunohistochemistry. B, changes in IL-1β, TNFα, COX-2 and COX-1 protein in the brains of rats following DFP exposure measured 2 hours after DFP-induced SE by ELISA. Data are box plots with a 25 and 75 range. The symbols represent each individual rat within the group (** = p < .01, one-way ANOVA with posthoc Dunnett’s compared to the “no treatment” controls). The color of the symbol correspond to the treatment received shown on the bottom of panel B. All four analytes (COX-1, COX-2, IL-1β, TNFα) were measured in all rats regardless of treatment. The protein level is the measured amount of each analyte by ELISA compared to the no treatment controls. C, fluorescence images taken from the cornu ammonis 3 (CA3) region in the hippocampus reveals basal expression of cFos in non-seizure control rats. cFos expression (bright red stain) is induced in rats that experienced 2 h of DFP-induced SE and to a lesser degree in rats that were administered DFP but did not experience SE (“DFP no SE”). The images shown are a single representative of 5 hippocampal sections each from 3 rats in the groups. Scale bar = 100 μm. D, fluorescence images taken from the CA3 region in the hippocampus reveals basal expression of neuronal COX-2 in non-seizure control rats. COX-2 expression is induced slightly in DFP no SE rats and more robustly in rats that experienced 2 h of DFP-induced SE. The images shown are a single representative of 5 hippocampal sections each from 3 rats in the groups. Scale bar = 100 μm. E and F, immunohistochemistry was performed on rat coronal hippocampal sections for IL-1β and NeuN. Fluorescent images taken from the CA3 region in the hippocampus (200x total magnification) revealed little basal expression of neuronal IL-1β in rats that did not experience status epilepticus (panel E; Control no SE, left insert). Neuronal IL-1β in the CA3 region is greatly induced 2 h after DFP-induced SE (panel F; DFP-SE, left insert). Green fluorescent images of the CA3 region in the hippocampus reveals expression of the neuronal marker NeuN (middle insert). The nuclei were labelled by Hoechst staining shown in blue (right insert). Overlaying the red IL-1β stain, the green NeuN stain and the Hoechst revealed IL-1β induction in the same neurons positively stained for NeuN for rats that experienced DFP-induced SE. An example of a neuron with IL-1β induction is magnified in the white outlined box (insert). The images shown are representative of five sections each from three to five rats. Scale bar, 30 μm.
