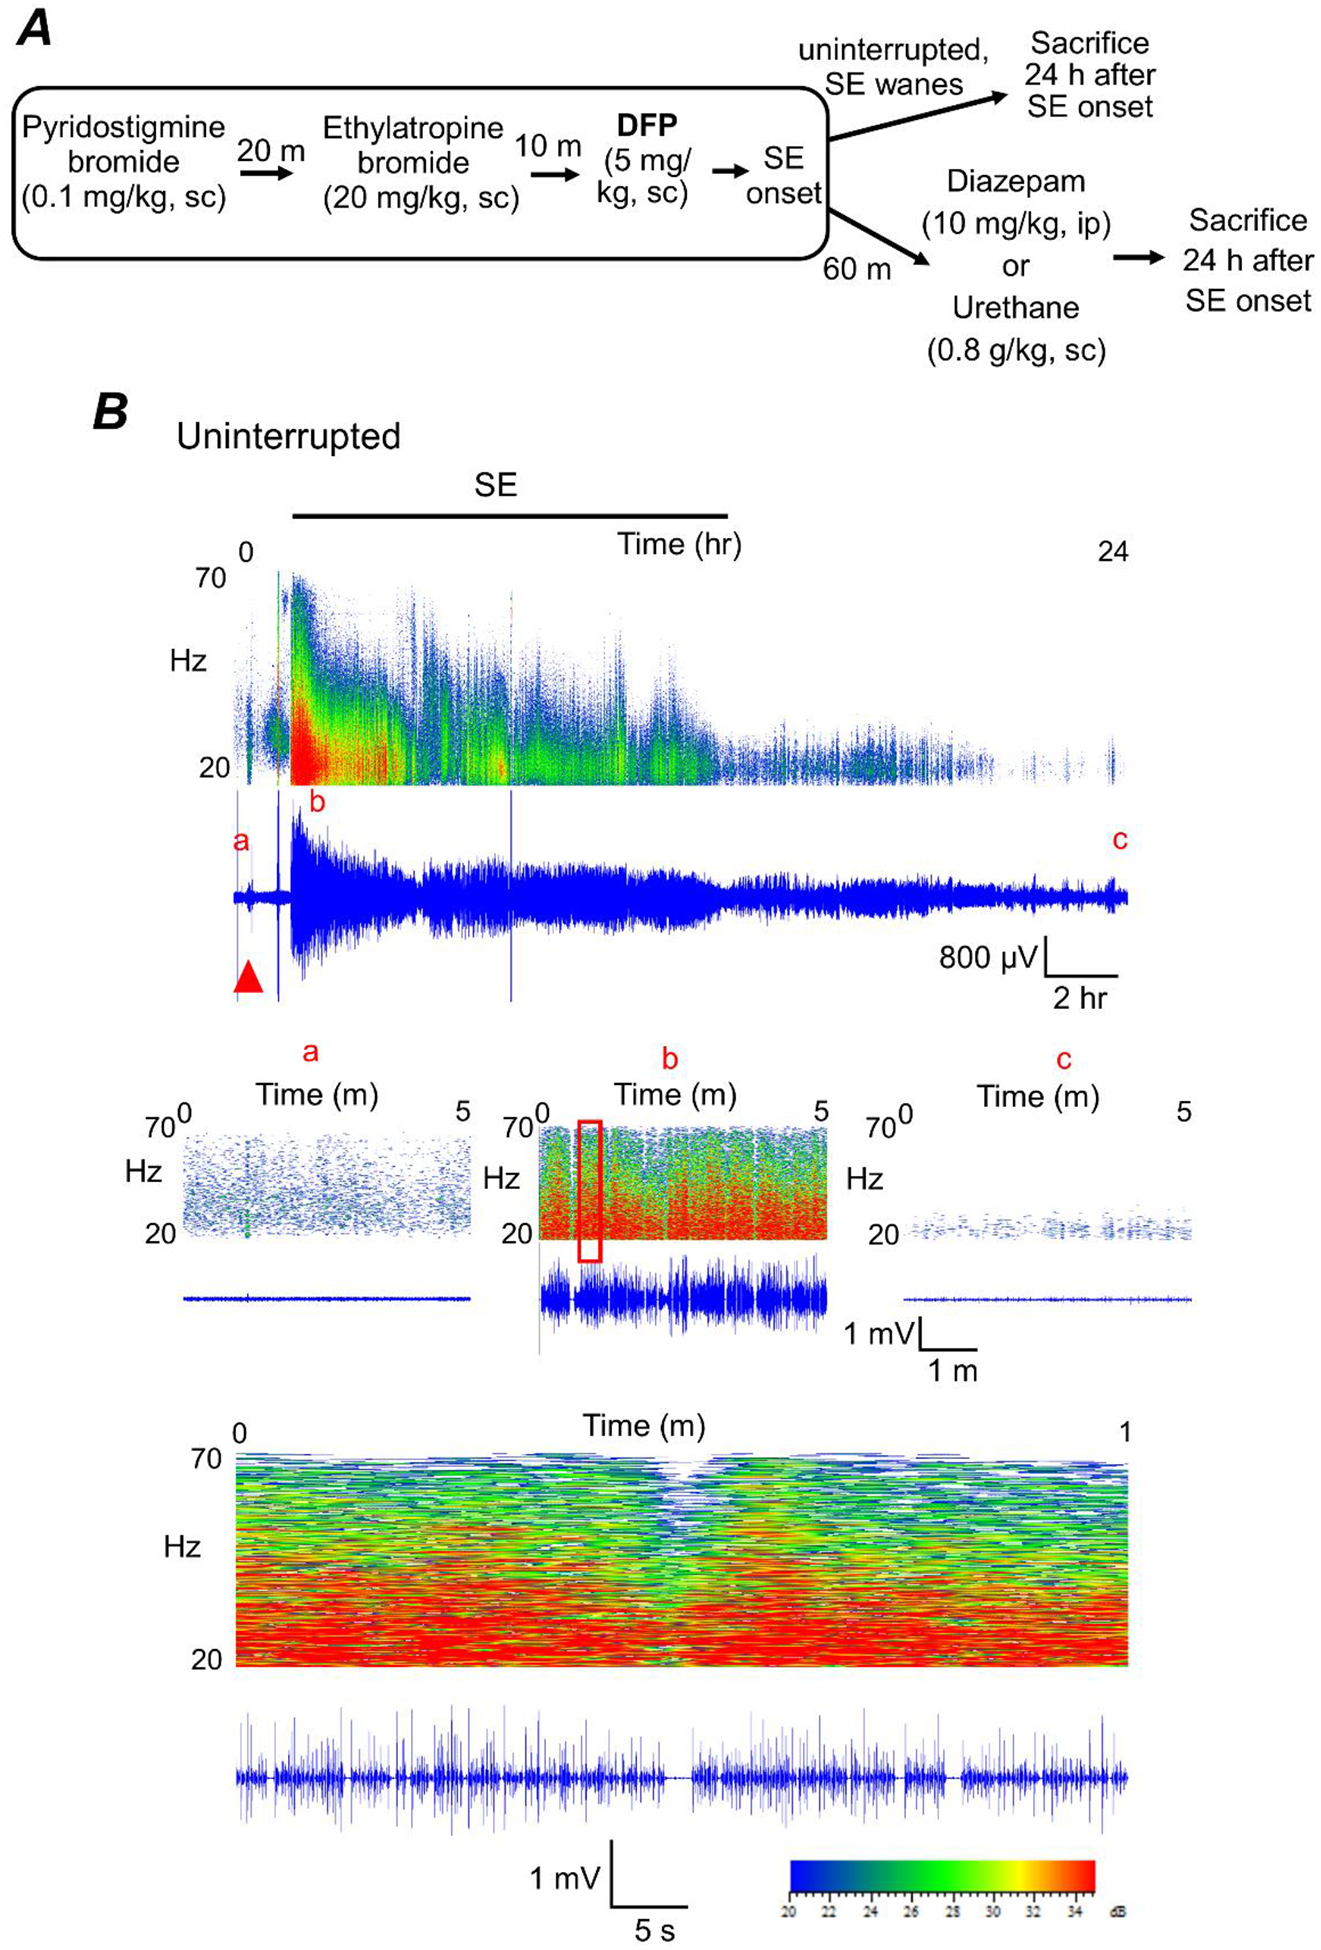
Figure 2. Experimental paradigm of chemical administration in a rat model of DFP-induced status epilepticus.

A, all rats were administered pyridostigmine bromide and ethylatropine bromide (Rojas et al., 2017) followed by DFP to induce status epilepticus. For the diazepam cohort, rats were injected with one dose of diazepam 1 h after DFP-induced SE onset. For urethane-treatment following DFP, rats were injected with a single dose of urethane 1 h after the onset of SE. A separate cohort of rats was not administered any drugs after SE onset (uninterrupted SE). All rats were sacrificed 24 h after SE onset. B, cortical electroencephalography (EEG) activity was recorded prior and during SE induced by exposure to DFP for 24 h. A representative EEG trace (in blue) from the cortical recording of an adult male rat showing increased spike activity just after exposure to DFP (red triangle) that develops into SE (denoted by the bar at the top). Above each raw EEG trace is a sonogram of the spike activity obtained in Spike2. The colors of the sonogram indicate the spectral power density in decibels (dB) at the indicated frequency. The middle panels show magnified 5-minute sections of the recording taken from the baseline prior to DFP (a), at the peak intensity of SE (b) and at the end of the recording (c). The area within the red outlined box in panel b was magnified and shown in the bottom panel that represents a 1 min interval of the recording during SE.
