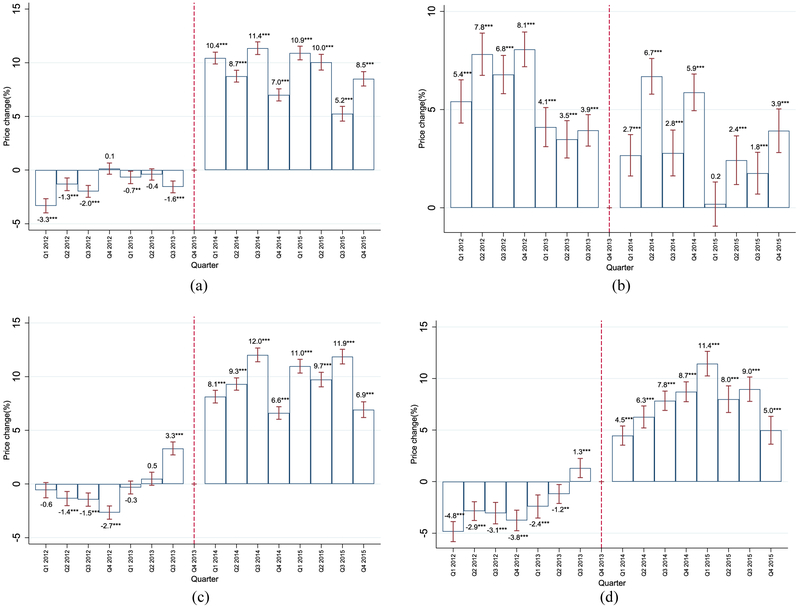
Fig. 3.
Quarterly changes in corrected prices. (a) Cookies, (b) Ready-to-eat cereals, (c) Salty snacks and peanuts, (d) Pre-packaged sweet bread. Notes: Confidence Intervals (95%) in red-capped spikes. Corrected prices correct for biases associated with households’ and retailers’ characteristics. Models included UPI and city fixed effects, a constant, lagged global indicator of economic activity, and population. ** p < 0.05, *** p < 0.010. Source: Authors’ own analyses and calculations based on data from Nielsen through its Mexico Consumer Panel Service (CPS) for the food and beverage categories for January 2012 – December 2015. The Nielsen Company, 2016. Nielsen is not responsible for and had no role in preparing the results reported herein. (For interpretation of the references to colour in this figure legend, the reader is referred to the web version of this article.)

