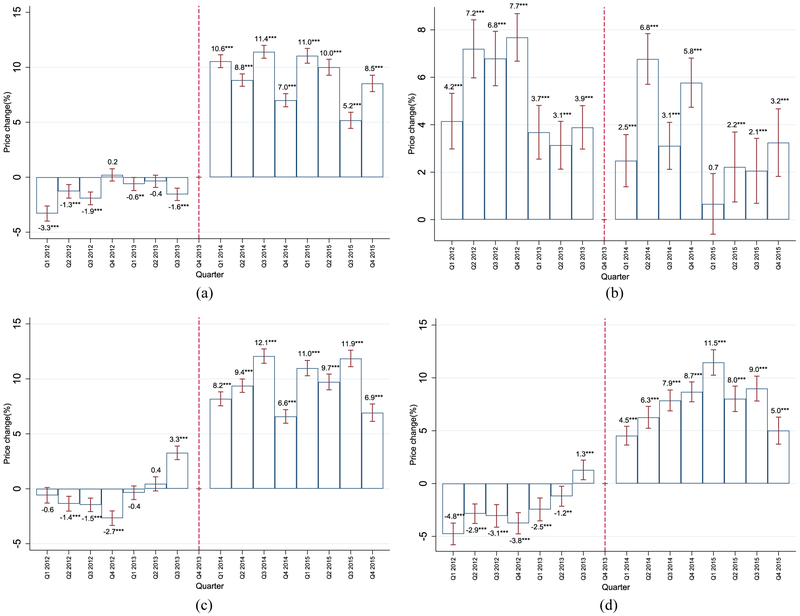
Fig. A1.
Quarterly changes in corrected prices on restricted sample. (a) Cookies, (b) Ready-to-eat cereals, (c) Salty snacks and peanuts, (d) Pre-packaged sweet bread. Notes: Confidence Intervals (95%) in red-capped spikes. Corrected prices correct for biases associated with households’ and retailers’ characteristics. Models included UPI and city fixed effects, a constant, lagged global indicator of economic activity, and population. ** p < 0.05, *** p < 0.010. Source: Authors’ own analyses and calculations based on data from Nielsen through its Mexico Consumer Panel Service (CPS) for the food and beverage categories for January 2012 – December 2015. The Nielsen Company, 2016. Nielsen is not responsible for and had no role in preparing the results reported herein.

