Figure 1.
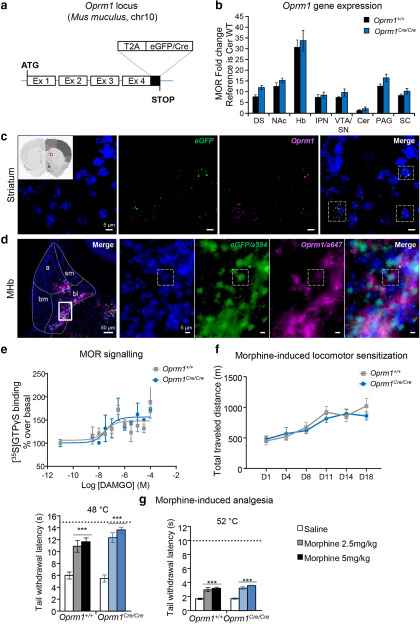
Intact MOR function in the Oprm1-Cre line. a, Targeting strategy: a cDNA encoding a functional EGFP/Cre recombinase fusion protein is inserted in frame and upstream the stop codon of the Oprm1 gene. In addition, a T2A cleavable peptide sequence is joining Oprm1 gene to the EGFP/Cre sequence, so that the EGFP/Cre enzyme is released from the receptor on translation of the MOR-T2A-EGFP/Cre fusion protein (Extended Data Fig. 1-1, Knockin (KI) genotyping strategy). b, Oprm1 mRNA expression levels are identical between Oprm1Cre/Cre and Oprm1+/+ mice. Quantification was done by RT-qPCR in samples from DS, NAc, Hb, IPN, VTA/SN, Cer, PAG, and SC and shows comparable Oprm1 transcript levels across genotypes. c, Confocal imaging of RNAscope probes targeting eGFP (green) and Oprm1 (purple) mRNAs in addition of DAPI staining (blue) shows colocalization of the two transcripts in dorsal striatum sections of Oprm1Cre/Cre mice (inset). Dashed lines delimit examples of MOR-EGFP/Cre-positive neurons. Magnification, 60× with immersion oil. Scale bar, 5 μm. d, Left, Immunohistochemistry shows EGFP/Cre and MOR protein expression in the same habenular subdivisions. Coronal brain sections of heterozygote Oprm1Cre/+ mice were stained with EGFP and MOR antibodies (Extended Data Fig. 1-2, MOR antibody validation), and fluorescence microscopy shows the expected staining mainly in basolateral (bl) and apical (a) parts of the MHb. Bm, Basomedial; sm, stria medullaris tract. Magnification:, 10×. Scale bar, 50 μm. Right, Four panels at higher magnification (inset, basolateral part of the MHb), staining reveals nuclear DAPI (blue) and EGFP/Cre (green) staining, whereas MOR staining (purple) is exclusively extranuclear. Magnification, 60× with immersion oil. Scale bar, 5 μm. Dashed lines delimit one example of an MOR-EGFP/Cre-positive neuron. e, MOR signaling is preserved in Oprm1Cre/Cremice. G-protein activation was evaluated using [35S]-GTPγS binding: DAMGO-induced G-protein activation is similar in striatal membranes to the two genotypes (n = 2 pools × 4 striatum; EC50, 324 nm for Oprm1+/+and 392 nm for OprmCre/Cre; Emax, 148 ± 7 for Oprm1+/+ and 156 ± 11 for Oprm1Cre/Cre). f, Locomotor sensitization of morphine is intact in Oprm1Cre/Cremice. Mice were injected at days 1, 4, 8, 11, 14, and 18 with morphine (40 mg/kg, i.p.). Total traveled distances recorded for 2 h are comparable in Oprm1+/+and Oprm1Cre/Cre mice (n = 7 animals/group). Data are presented as the mean ± SEM. g, Analgesic effects of morphine are intact in Oprm1Cre/Cremice. Analgesia was assessed by tail immersion test: identical tail withdrawal latencies were measured at 48°C and 52°C, in wild-type Oprm1+/+and Oprm1Cre/Cremice 45 min after a single saline or morphine injection (2.5 or 5 mg/kg; n = 10 animals/group). Dashed horizontal lines show cutoff at 15 s for 48°C and 10 s for 52°C. Data are presented as the mean ± SEM. ***p < 0.001 morphine effect compared with saline.

