Figure 1.
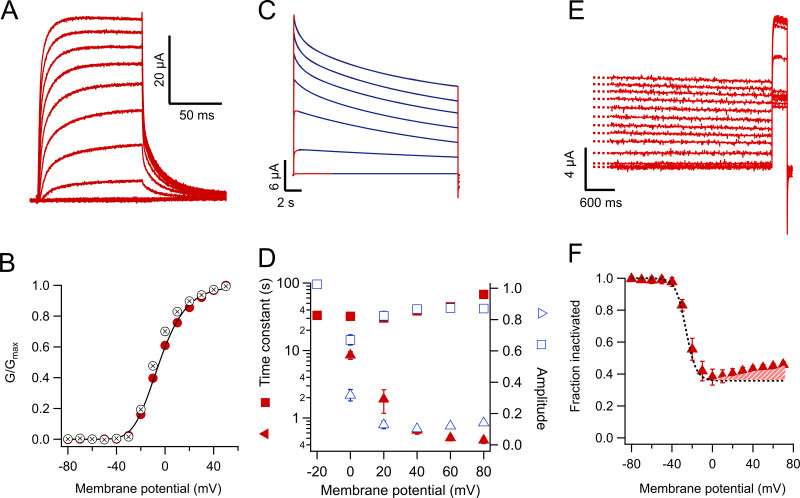
KV1.2 WT channels slow-inactivate incompletely. (A) Currents in response to short voltage-clamp pulses to 50 mV applied from a holding potential of −80 mV and lasting 100 ms. Tail currents are observed upon return to a potential of −30 mV. (B) Voltage dependence of the normalized conductance at the test potential (red circles) or the normalized size of the tail current at the beginning of the −30 mV pulse. The data are the mean and error bars are the SEM from n = 7 oocytes (conductance) or n = 15 (tails). The black curve is the fit of the conductance data to Eq. 2 with parameters Ko = 0.13, zapp = 1.77 eo. (C) Currents in response to long (20-s) pulses from −40 to 80 mV in 20-mV steps. The current slowly decays in amplitude as a result of a slow inactivation process. The decay kinetics can be fitted by a sum of two exponential functions. The fit to Eq. 3 is shown by the continuous blue lines, except the −20 mV trace, which was fitted to a single exponential. (D) Inactivation time constants are plotted as a function of voltage. The filled square symbols are the slow time constant, and the filled triangles are the fast time constant. Amplitudes are shown by empty symbols. (E) Protocol to determine the voltage dependence of steady-state inactivation at the end of a 20-s pulse. The current elicited by a 50-mV pulse and 300-ms duration after the long 20-s pulses is reduced as a consequence of accumulated inactivation. (F) Quantitation of the steady-state inactivation in an h∞-like curve. Note that inactivation is relieved at voltages more positive than 20 mV. The dashed black curve is the fit of a Boltzmann-like function to the data from −80 to 0 mV, with an apparent valence of 5 eo. The difference at positive voltages between the fit and the data emphasizes the U-type inactivation character of the process.

