Figure 2.
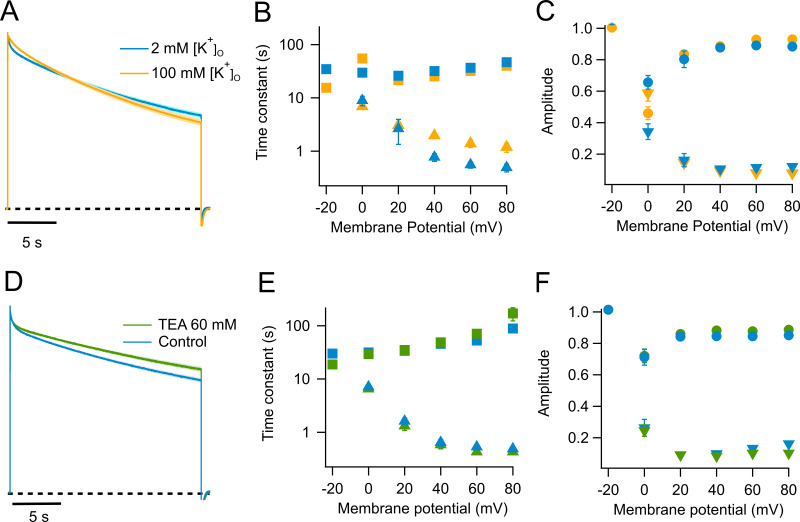
Effect of extracellular potassium and TEA on slow inactivation in WT KV1.2. (A) Outward currents in response to a 60-mV, 20-s pulse. The blue trace is the normalized average current from eight experiments recorded in 2 mM external K+. The yellow trace is the normalized average current from eight traces recorded in the presence of 100 mM external K+. (B) Quantitation of the effect of potassium on the time constants of inactivation. The color code is the same as in A; squares, slow time constant; triangles, fast time constant. (C) Amplitudes of the fast (inverted triangles) and slow (circles) components are plotted. (D) Effect of external TEA on the kinetics of slow inactivation. The blue trace is the normalized average current at 60 mV from seven traces in the absence of TEA and at 2 mM external potassium. The green trace is the normalized average current from seven sweeps in the presence of 60 mM external TEA also with 2 mM external potassium. (E) Effect of TEA in the slow (squares) and fast (triangles) time constants. (F) Effect of TEA on the amplitudes of the fast (inverted triangles) and slow (circles) time constants. In A and D, the light-colored shade along the current trace is the SEM. Error bars in B, C, E, and F are ± SEM.

