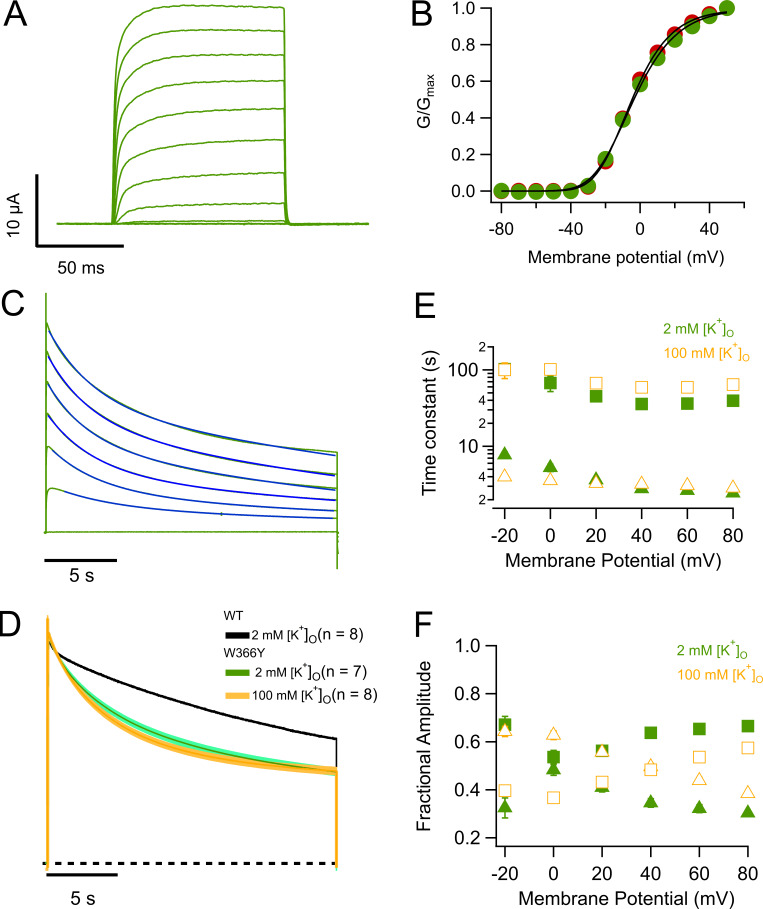
Figure 3.
Mutation W366Y accelerates slow inactivation. (A) Ionic currents in response to 100-ms depolarizing pulses from −80 to 50 mV in 10-mV steps, from a holding potential of −80 mV. Currents are very similar to WT channels. (B) Comparison of the voltage dependence of W366Y and WT KV1.2. The normalized conductance of both channel types is plotted as a function of voltage. Red circles correspond to WT and green circles to W366Y. The continuous curve corresponds to the fit to Eq. 2 with parameters zapp = 1.77 eo, Ko = 0.135 (WT); zapp = 1.59 eo, Ko = 0.149 (W366Y). (C) Mutant channels also inactivate slowly and more completely than WT channels. Blue lines are the fit to Eq. 3. (D) High potassium speeds up inactivation. Green trace is the normalized average current at 60 mV from seven oocytes in the presence of 2 mM external K+. The yellow trace is the normalized current average from eight oocytes in 100 mM external K+. In both cases, the shaded areas represent ± SEM. The black dashed curve is the average WT current time course, also at 60 mV. (E) Voltage dependence of the time course of slow inactivation. Filled symbols are the slow and fast time constants in ND96 extracellular medium ([K+]o = 2 mM). Empty symbols are the slow and fast time constants in the presence of 100 mM extracellular potassium. Squares are the slow time constant and triangles the fast time constant. (F) Amplitudes of the two components in E. Squares are the slow time constant amplitude and triangles the fast time constant amplitude. Error bars in B, E, and F are ± SEM.

