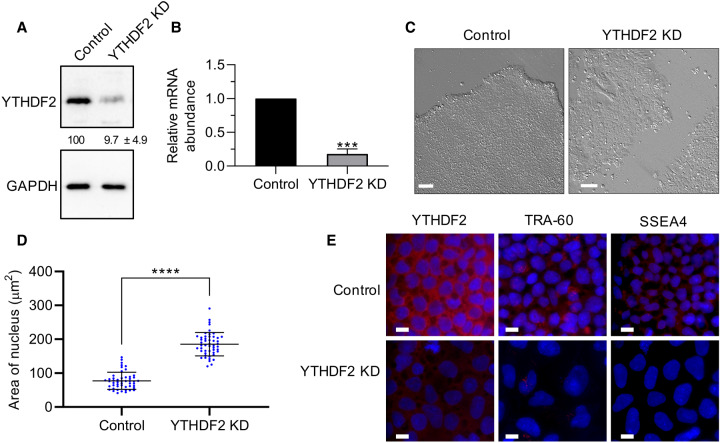
FIGURE 2.
Depletion of YTHDF2 in iPSCs results in morphological changes. (A) Representative western blot using iPSC extracts to demonstrate effective depletion of YTHDF2 following 2 d of siRNA treatment. GAPDH was used as a loading control. Percent protein remaining calculated from three independent biological replicates is indicated below the lanes. (B) RT-dPCR analysis of YTHDF2 mRNA abundance in siRNA negative control and YTHDF2 depleted samples normalized to GAPDH mRNA. Asterisks indicate significant difference in mean abundance between control and YTHDF2 KD samples ([***] P-value <0.0005). (C) Bright field images of siRNA negative control and YTHDF2-depleted iPSC colonies following 5 d of treatment. Scale bars indicate 100 µm. (D,E) iPSCs were subjected to 5 d of treatment with negative control or YTHDF2 siRNAs. The nucleus was stained with DAPI. (D) Nucleus size of siRNA negative control or YTHDF2 depleted cells (cells = 50) was quantified via ImageJ. (*) P-value <0.05. (E) The indicated protein was detected by immunofluorescence (IF) staining. Scale bars indicate 10 µm. n = 2.

