FIGURE 3.
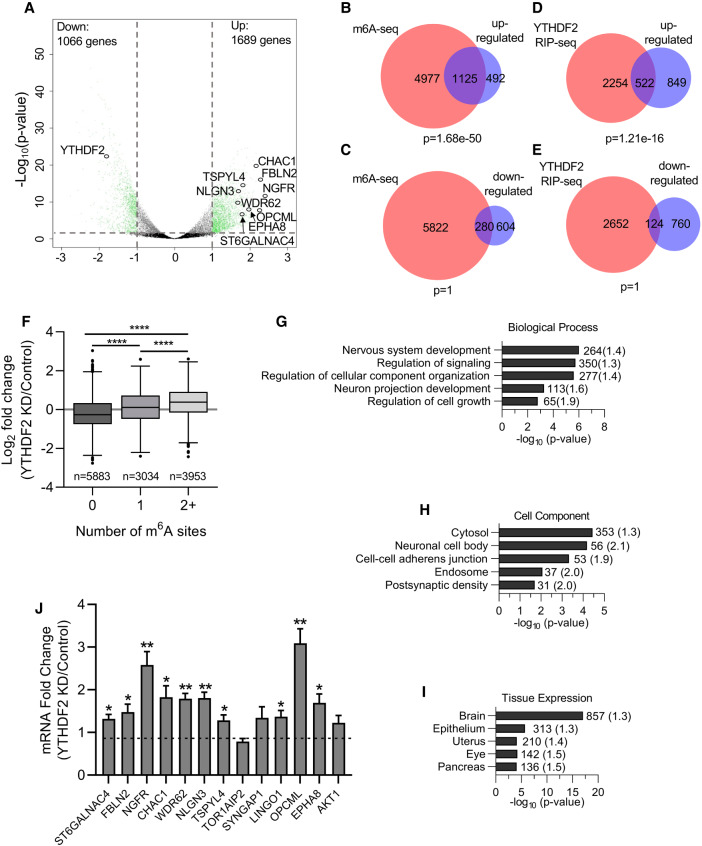
YTHDF2 depletion affects transcripts required for neural development. (A) Volcano plot generated from sequencing data showing the adjusted P-value (y-axis) plotted against the fold change (x-axis) for individual genes. Differentially expressed genes are shown in green (differential expression: read counts >5, Benjamini-Hochberg adjusted P-value <0.05, and log2-fold change >1.0, represented by gray dotted lines). Neural-specific transcripts evaluated in subsequent figures are labeled. (B–E) Venn diagrams showing the overlap between transcripts up-regulated (B,D) or down-regulated (C,E) following YTHDF2 depletion and transcripts previously shown to be m6A methylated in hESCs (B,D) (Batista et al. 2014) or bound by YTHDF2 (C,E) (Wang et al. 2014a). P-values were determined using a hypergeometric test. (F) Boxplot of the log2 fold change in expression (YTHDF2 KD/Control), taken from results generated by DESeq2, vs. number of m6A sites. Transcripts were binned based on the number of m6A sites identified in Batista et al. (2014). The central line of the box plot represents the median log2 fold change expression value. n denotes the number of genes in each bin. Binned groups were compared using an unpaired two-sided Student's t-test ([****] P-value <0.0001). (G–I) Functional annotation clustering of biological process (G), cellular component (H), and tissue expression (I) performed by DAVID on genes up-regulated following YTHDF2 depletion. Annotation clusters with the highest enrichment according to FDR P-value are listed. The number of genes in each cluster is shown next to the respective bar and fold enrichment over background is given in parentheses. (J) RT-dPCR analysis of mRNA abundances in control and YTHDF2 depleted samples normalized to GAPDH. Data are reported as fold change (YTHDF2 KD/Control). Asterisks indicate significant difference in mean abundance between control and YTHDF2 KD samples ([*] P-value <0.05, [**] P-value <0.005).

