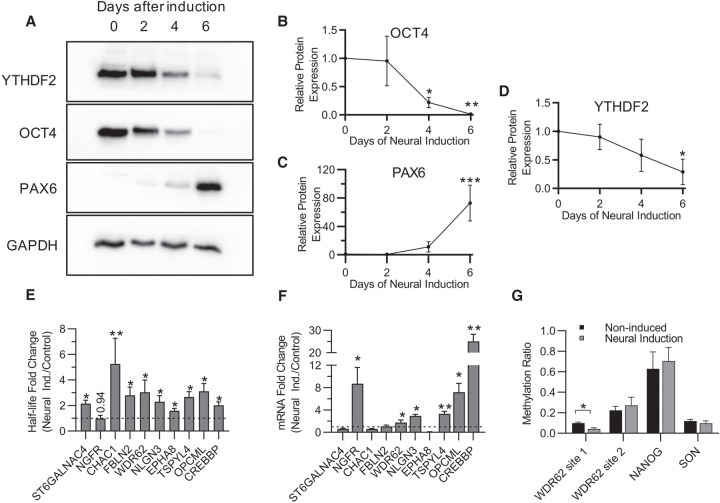
FIGURE 5.
Changes in YTHDF2 expression and m6A abundance after neural differentiation increase mRNA half-life and abundance of neural-associated transcripts. (A) Representative western blot of YTHDF2, OCT4, and PAX6 protein expression at 0, 2, 4, and 6 d after neural induction. GAPDH was used as a loading control. (B–D) Expression of OCT4 (B), PAX6 (C), and YTHDF2 (D) over the time course was normalized to GAPDH, and the 0 d time point was set to 100% relative protein expression for each replicate. Normalized protein expression from 2, 4, and 6 d after induction was reported as percent protein expression compared to 0 d time point. Asterisks indicate significant difference between the given time point and 0 d induction ([*] P-value <0.05, [**] P-value <0.005, [***] P-value <0.0005). (E) Half-lives from noninduced (control) and 6 d neural induced samples were generated by RT-dPCR analysis of Total and Nascent samples using the formula from Rädle et al. (2013) and normalized to a 4sU-labeled synthetic RNA to account for experimental variation. Data are reported as fold change (Neural Induced/Control). Asterisks indicate significant difference in mean half-life between control and neural induced samples ([*] P-value <0.05, [**] P-value <0.005). Nonsignificant P-values are given above bars. (F) RT-dPCR analysis of mRNA abundances, normalized to GAPDH, from samples that underwent no induction (control) and 6 d of neural induction. Data are reported as fold change (Neural Induced/Control). Asterisks indicate significant difference in mean abundance between control and neural induction samples ([*] P-value <0.05, [**] P-value <0.005). (G) The methylation ratio at four m6A positions quantified by MazF-dPCR using samples that underwent no induction (WT) and 6 d of neural induction. Asterisks indicate significant difference in mean methylation ratio between WT and neural induced samples ([*] P-value <0.05).

