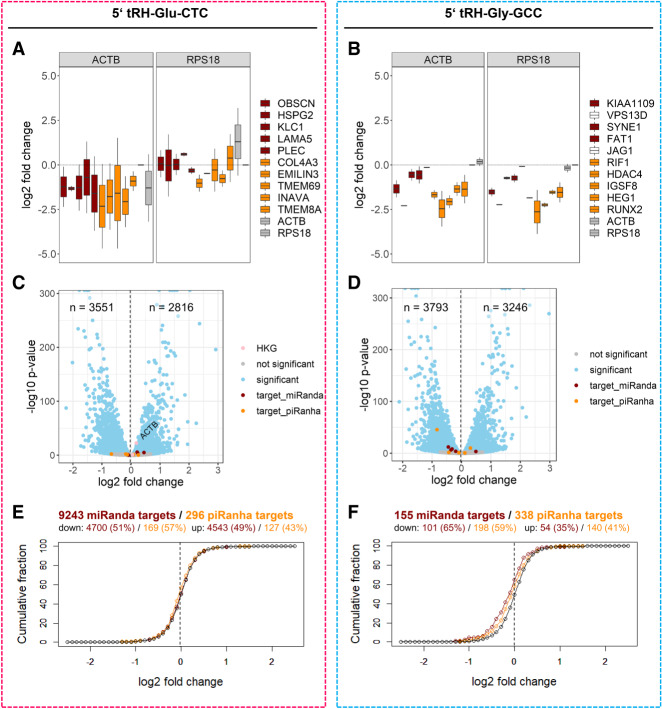
FIGURE 3.
(A,B) qPCR quantified log2 fold change of potential 5′ tRH targets in 5′ tRH overexpression HEK293T cells compared to control cells. The selected transcripts were predicted by miRanda (red) and piRanha (orange) to be targets of the 5′ tRNA-halves Glu-CTC (A) or Gly-GCC (B). The housekeeping genes ACTB and RPS18 were used as normalizers. Note that normalization by ACTB is not suitable in case of the 5′ tRH-Glu-CTC overexpression (A), as the expression of ACTB is up-regulated in this condition (also revealed by RNA-seq; see C). (C,D) Volcano plot of differential expression analysis for protein-coding genes of 5′ tRH overexpression and control HEK293T cells (blue, adjusted P-value <0.01). The 10 previously tested putative target genes are highlighted in red (miRanda prediction) and orange (piRanda prediction). For the 5′ tRH-Glu-CTC analysis (C), the housekeeping genes ACTB and RPS18 are additionally highlighted in pink, showing that ACTB gets up-regulated upon 5′ tRH-Glu-CTC overexpression, while the RPS18 expression is not affected. (E,F) Cumulative fraction plots for log2-fold-change values of genes that were identified as potential targets of the 5′ tRHs Glu-CTC or Gly-GCC by miRanda (red; threshold: miRanda-score < −80) or piRanha (orange; threshold: piRanha-score < −30) and of genes not predicted as targets by the respective algorithm (black).

