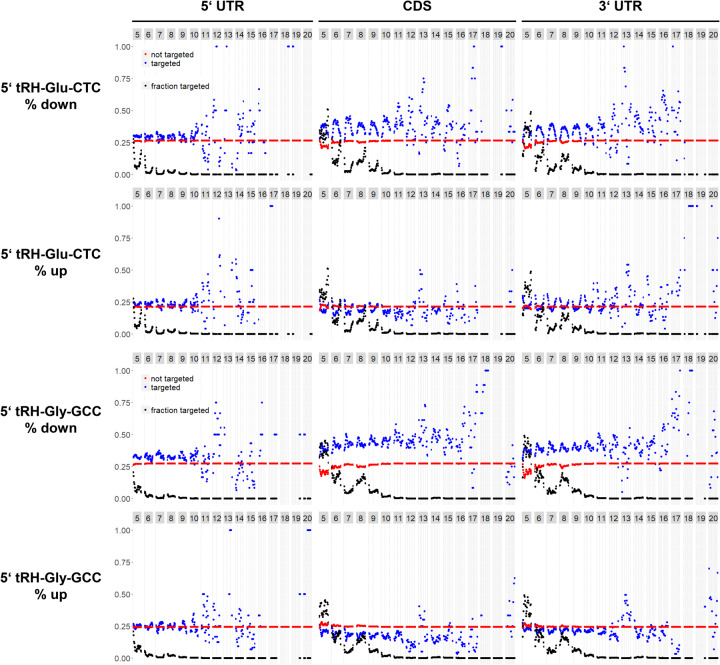
FIGURE 5.
k-mer analysis to elucidate the targeting rules of 5′ tRH-mediated transcript regulation in HEK293T cells. The y-axis refers to the fraction of up- or down-regulated genes. Blue dots refer to genes that have a corresponding k-mer alignment, red dots refer to genes that do not have a corresponding k-mer alignment. Black dots refer to the overall fraction of genes that align to the corresponding k-mer (declines with growing k-mer size). The numbers in the gray boxes above each plot indicate the respective k-mer length in nucleotides. That is, dots within the first column (with k-mer length = 5 nt) all refer to genes that align to k-mers with a length of 5 nt. Further, dots at the very left of a column refer to genes that align to k-mers from the very 5′ end of the parent tRH, while dots at the very right of a column refer to genes that align to k-mers from the very 3′ end of the parent tRH. Dots in between correspond to genes that align to k-mers derived from a corresponding position inside the parent tRH.

