FIGURE 6.
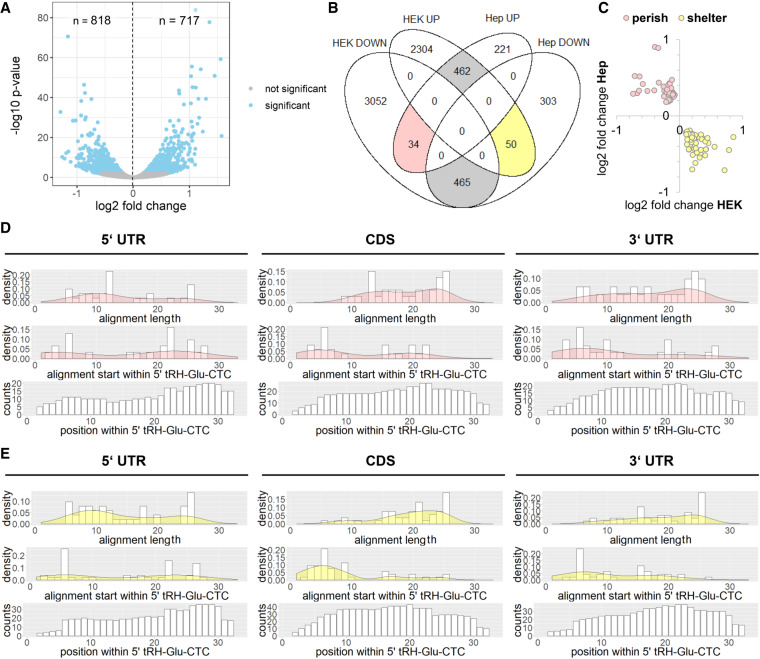
(A) Volcano plot of differential expression analysis for protein-coding genes of 5′ tRH antisense-inhibition and control HepG2 cells (blue, adjusted P-value <0.01). (B) Venn diagram of significantly differentially expressed genes. Genes that are likewise regulated in HEK as in HepG2 cells are highlighted in gray. Genes that are inversely regulated in HEK overexpression and HepG2 inhibition cells are highlighted rosy (“potential perish targets”) and lutescent (“potential shelter targets”). (C) Log2 fold change values of perish and shelter transcripts in the HEK overexpression and HepG2 antisense-inhibition experiments. (D,E) Analysis of thermodynamically favored alignments for the major transcript regions of “potential perish targets” or “potential shelter targets” with 5′ tRH-Glu-CTC.

