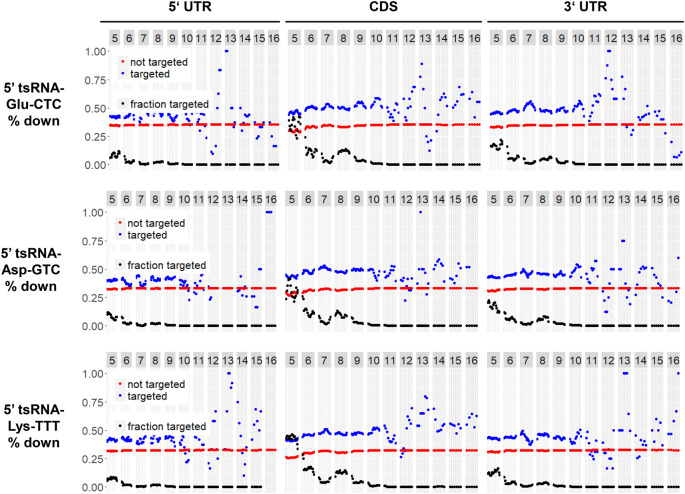
FIGURE 7.
Target pattern analysis of published RNA sequencing data of fly S2 cells, where the 20 nt long 5′ tsRNA Glu-CTC, 5′ tsRNAs Asp-GTC or Lys-TTT was overexpressed by tsRNA mimic transfection (Luo et al. 2018). Plotted is the percentage of genes with (blue) or without (red) k-mer alignment that get down-regulated.

