
Fig. 6.
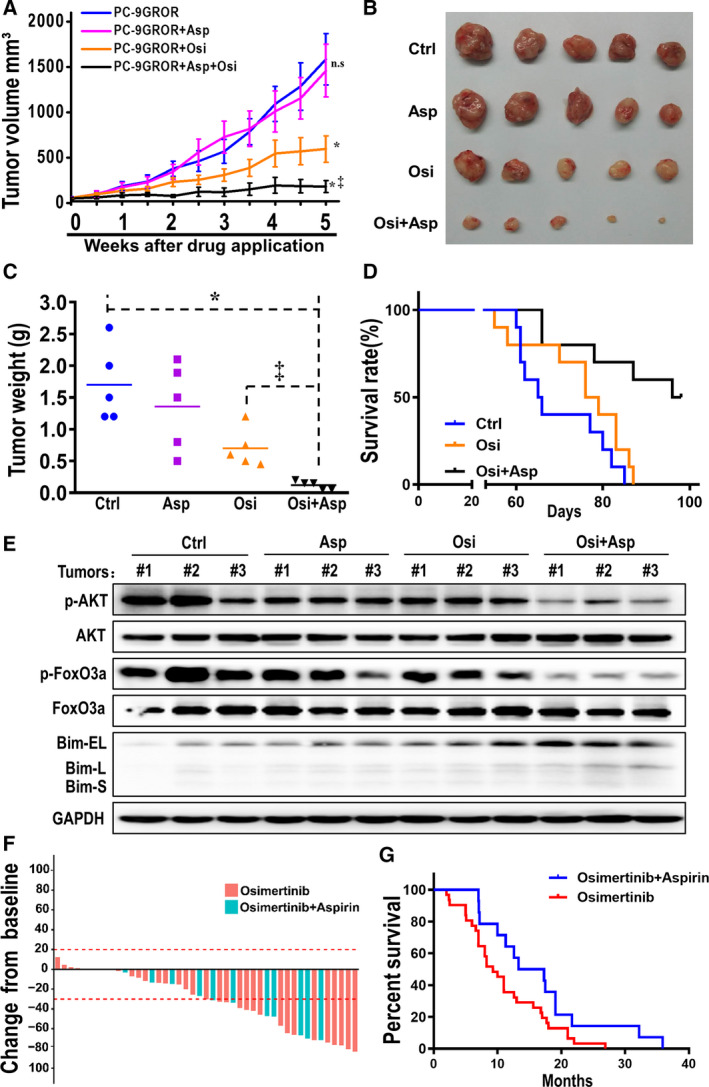
Combination of osimertinib and aspirin effectively inhibited the tumor growth in PC‐9GROR xenografts. (A) Tumor volume (mm3) in PC‐9GROR cells with various applications was shown. *P < 0.05 compared with the control group; ‡ P < 0.01 compared with the osimertinib alone group; n.s: not significant. (B) Macroscopic appearance of tumors after drug application for 5 weeks. (C) Tumor weight (g) in PC‐9GROR cells with various applications was shown. *P < 0.05 compared with the control group; ‡ P < 0.01 compared with the osimertinib alone group. (D) Kaplan–Meier survival curves were presented for the above three groups. The log‐rank test demonstrated a significant difference between the osimertinib plus aspirin group and the osimertinib alone group. (E) Bim, AKT, and FoxO3a phosphorylation were examined from three tumors randomly selected from each group for western blotting. GAPDH was used as a loading control. (F) Best change from baseline in tumor size (n = 45). Dotted lines at 20% and −30% indicate the percent change from baseline and represent progressive disease and PR, respectively, per RECIST v1.1. (G) Kaplan–Meier analysis of NSCLC patients treated with osimertinib plus aspirin and osimertinib alone after the development of first‐generation EGFR‐TKI resistance (PFS analysis).