
Figure 2.
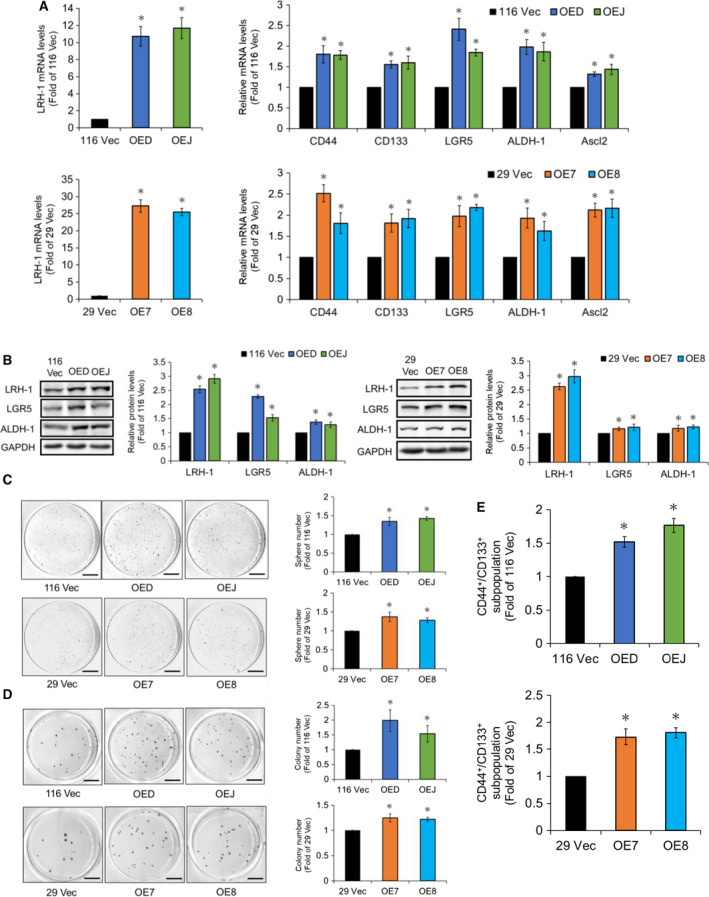
LRH‐1 overexpression increases various stemness properties in HCT‐116 and HT‐29 cells. (A) The mRNA levels of LRH‐1 (left) as well as CRCSC markers such as CD44, CD133, LGR5, ALDH‐1, and Ascl2 (right) in the vector control (116 Vec) and the LRH‐1‐overexpressing HCT‐116 (OED and OEJ) (top) as well as the vector control (29 Vec) and the LRH‐1‐overexpressing HT‐29 (OE7 and OE8) (bottom) clones were analyzed by RT‐qPCR. (B) Total lysates (30 µg) prepared from the 116 Vec, OED, and OEJ clones (left) as well as the 29 Vec, OE7, and OE8 clones (right) were subjected to immunoblot analysis using antibodies against the indicated proteins. GAPDH signals were used as loading controls. (C) Cells from three HCT‐116 clones (1 × 10⁴/well, upper) and three HT‐29 clones (5 × 10⁴/well, lower) were cultured, respectively, in defined media for 20 days. Spheres stained by MTT were scanned, and their numbers were counted by metamorph software. Scale bar, 0.7 cm. (D) Cells from three HCT‐116 clones (1 × 10³/well, upper) and three HT‐29 clones (1 × 10⁴/well, lower) were cultured in 0.3% agar on top of 0.6% agar for 20 days. Colonies stained by MTT were scanned and their numbers were counted by metamorph software. Scale bar, 0.7 cm. (E) Flow cytometry was applied to examine the CD133+/CD44+ subpopulations in the 116 Vec, OED, and OEJ clones (upper) as well as the 29 Vec, OE7, and OE8 clones (lower), respectively. Data are mean ± SD from three independent experiments. *P < 0.05 compared with those of the corresponding vector‐control clones by Student's t‐test.