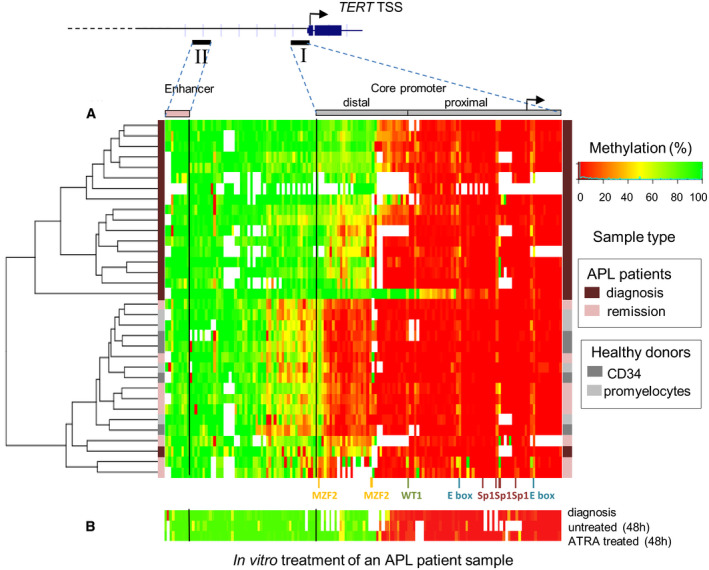
Fig. 1.

Hierarchic cluster analysis of APL patients' samples and methylation profile at hTERT promoter and enhancer. (A) The methylation heat map generated from the unsupervised hierarchical clustering is based on raw RRBS (reduced representation bisulfite sequencing) DNA methylation values in patients at diagnosis and remission, and healthy donors. (B) In vitro ATRA treatment of one APL patient sample for 48 h. White color indicates unavailability of data. The color grid on each side visualizes the sample characteristics.
