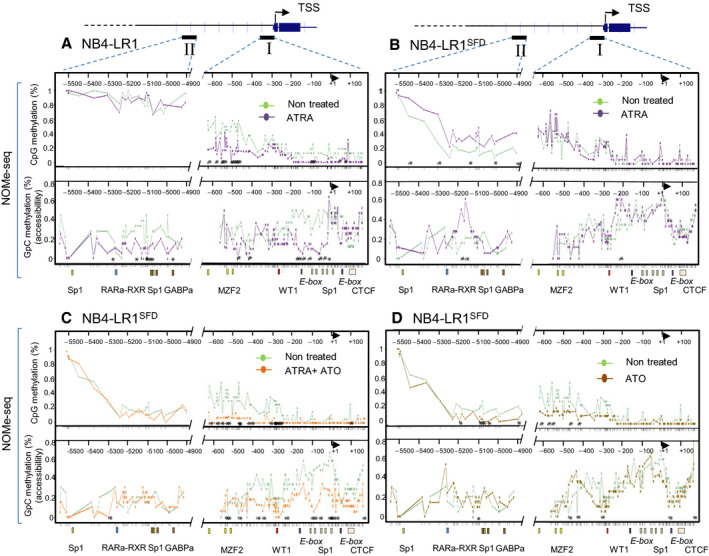
Fig. 3.

Chromatin accessibility and endogenous CpG methylation at the hTERT gene promoter as determined by NOMe‐seq analysis. NOMe‐seq was used to determine in the same time the level of endogenous DNA methylation and chromatin accessibility on individual DNA molecules for two subregions of the hTERT gene promoter visualized on the upper part of the figure as region I and region II. Region I encompasses hTERT TSS, and region II corresponds to the upstream conserved sequence described as an enhancer. For each sequence, 10–20 clones were analyzed from DNA obtained from NB4‐LR1 (panel A) and NB4‐LR1SFD (panel B–D) cells treated or not as indicated. The upper part of each panel indicates endogenous DNA methylation, the lower part chromatin accessibility. Data visualization as methylation profiling plot was performed using Methylation plotter web tool (Mallona et al., 2014). Each line represents for each group of samples the methylation mean for each position. Asterisks indicate a statistical significance between the treated and untreated groups as calculated by Kruskal–Wallis test (P < 0.05). Ticks in x‐axis indicate individual CpG (upper panel) and GpC (lower panel), respectively. Transcription factor binding sites (colored boxes) and TSS (solid arrow) are depicted.
