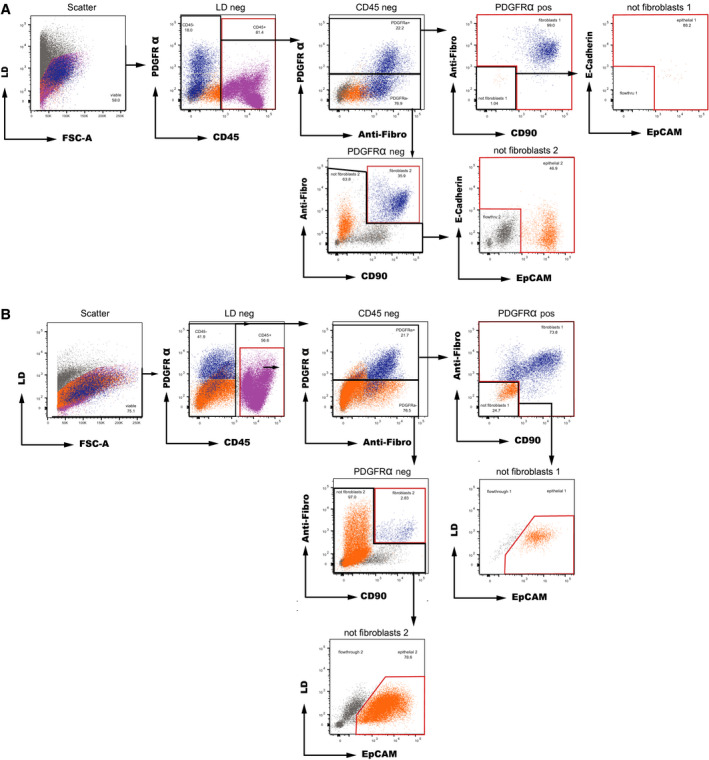
Fig. 2.

Representative sample processing for separation of EAC cell populations from endoscopic biopsies by flow cytometry sorting with E‐Cadherin co‐staining (A) and without E‐Cadherin co‐staining (B). After initial viability gating, cells were separated into the (a) CD45+ immune cell population (pink); (b) fibroblast cell population (blue), defined as positive for at least two out of three of PDGFRα, anti‐fibroblast, and CD90; and (c) epithelial cell population (dark orange) that were positive for EpCAM and/or E‐Cadherin (A) or simply positive for EpCAM (B). The sorted cell subpopulations are highlighted in red.
