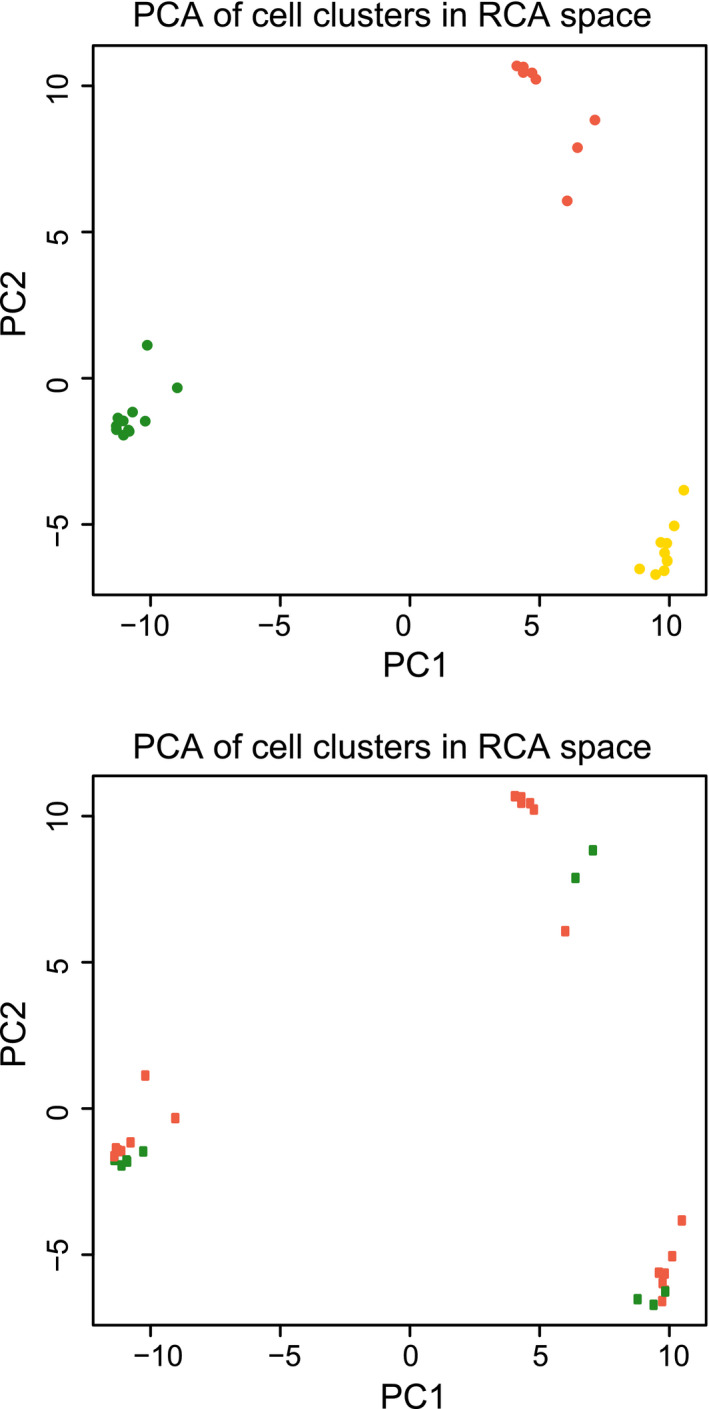
Fig. 3.

Principal component analysis of RNA‐seq of flow cytometry‐sorted cell fractions. Thirty‐one cell fractions were 3′RNA‐sequenced and plotted by their first two principal components. Top: orange, epithelial cells; yellow, fibroblasts; green, leukocytes. Bottom: orange, tumor cells; green, normal cells.
