
Fig. 1.
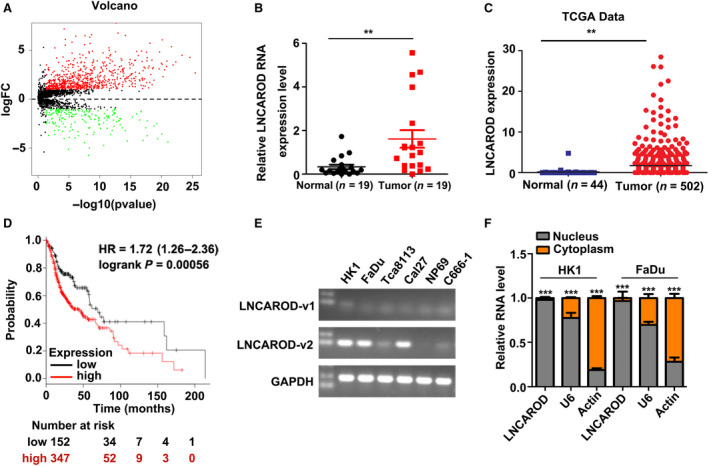
LNCAROD is overexpressed in HNSCC and predicts unfavorable clinical outcome. (A) Volcano plot described that the differentially expressed lncRNAs in HNSCC. (B) Measurement of LNCAROD expression level by RT‐qPCR assay in fresh HNSCC and normal tissues. (C) LNCAROD is upregulated in HNSCC samples according to TCGA dataset. (D) High level of LNCAROD predicts shortened OS in HNSCC patients. (E) Expression levels of LNCAROD variants in HNSCC cell lines, and normal cells were determined by RT‐PCR assay. (F) RT‐qPCR assay indicated that LNCAROD mainly distributes in nucleus fraction (n = 3 per group). All data are mean ± SD. Data were analyzed by using Student's t‐test. **P < 0.01, ***P < 0.001.