
Fig. 7.
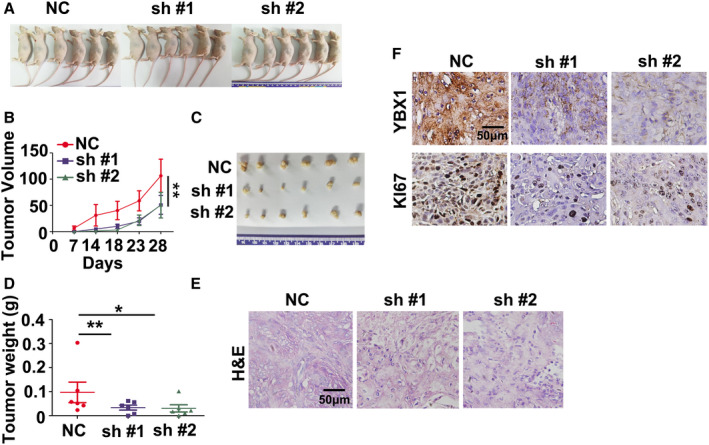
LNCAROD promotes tumor formation in vivo. (A) Gross view of nude mice bearing xenograft tumors. (B) Growth curve of xenograft tumors from LNCAROD‐silenced or control HK1 cells (n = 6 per group. Data were analyzed using two‐way ANOVA). (C) Macroscopic view of xenograft tumors from LNCAROD‐silenced or control HK1 cells. (D) Measurement of the weight of xenograft tumors (n = 6 per group. Data were analyzed using Student's t‐test). (E) H&E staining of xenograft tumors derived from LNCAROD‐silenced or control HK1 cells. (F) Immunohistochemical staining of YBX1 and Ki‐67 proteins in xenograft tumors. All data are mean ± SD. *P < 0.05, **P < 0.01.