
Fig. 1.
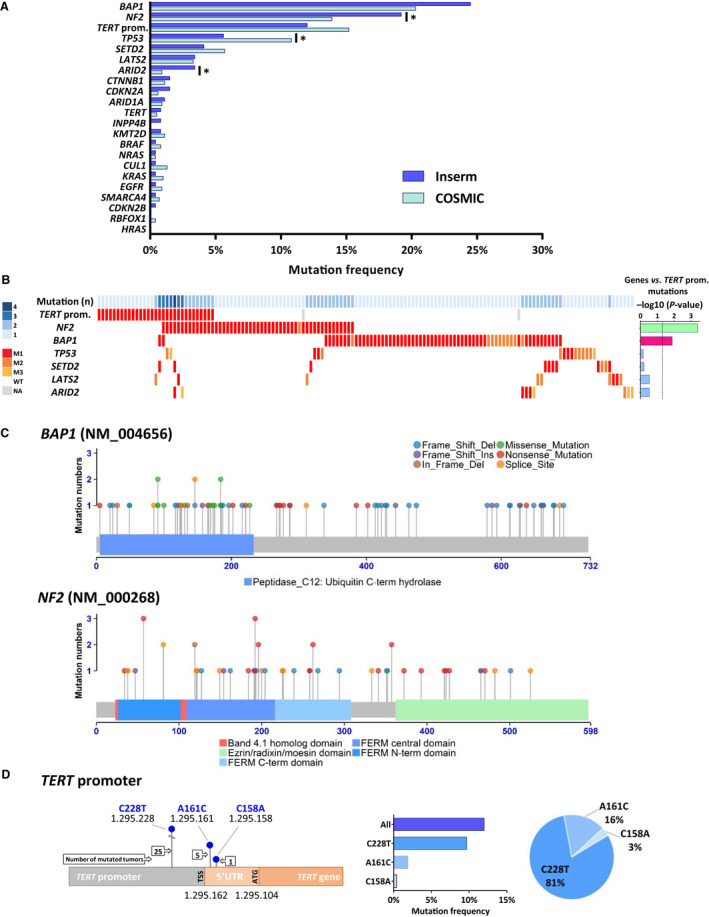
Genetic alterations in MPM. (A) Mutation frequencies in the Inserm and COSMIC series. P‐values were determined by Fisher's exact test (*P < 0.05). (B) Distribution of mutations in MPM. MPM tumor samples with at least one mutation in the TERT promoter or the six genes most frequently mutated (142 cases) are shown. The number of mutated genes in each sample is indicated by a blue gradient color at the top. Histogram on the right corresponds to −log10 (P‐value) of the Fisher's exact test comparing association between TERT promoter mutations and other mutations. Lateral bars in magenta and green colors represent significant mutually exclusive and associated mutations, respectively. The black dashed line corresponds to a P‐value threshold of 0.05. WT, wild‐type; M, mutated; M1, nonsense substitutions, inframe or frameshift indels and splice sites; M2, missense substitutions damaging; M3, missense substitutions probably damaging. (C) Schematic representation of BAP1 and NF2 (Merlin) proteins with mutations mapped (Inserm series). Point mutations are represented as lollipops. Legends of the protein domains and the mutation types are indicated at the bottom and at the top, respectively. (D) Schematic representation of the TERT promoter annotated with the localizations of the TERT transcription (TSS) and translation (ATG) start sites and the hotspot mutation sites as blue lollipops. Nucleotide numbering indicates the position on chromosome 5 in the GRCh37 assembly. Numbers of mutation at each site are indicated in arrow boxes. On the right, the histogram and the pie chart show the percentage of mutation and the proportions of mutation at each site, respectively.