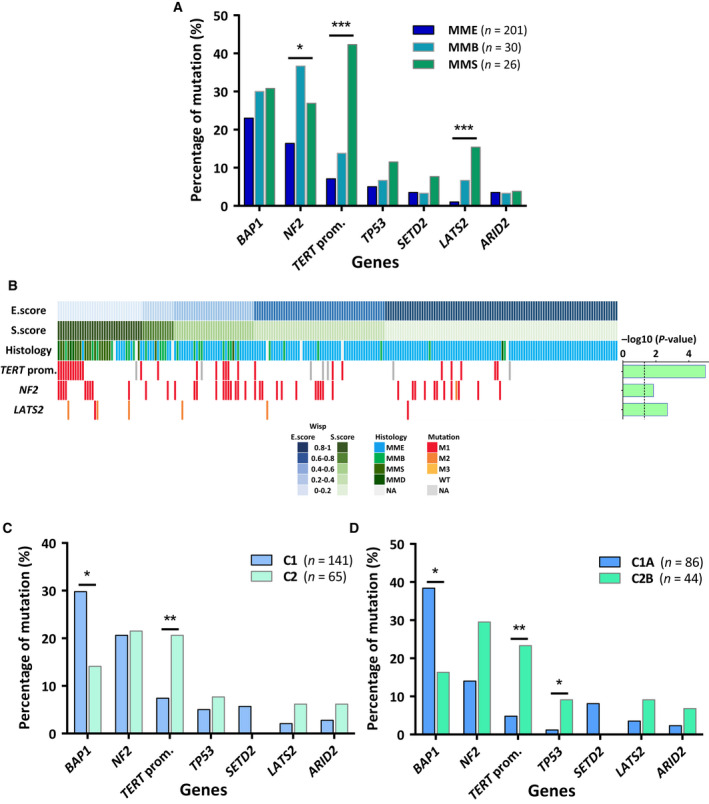
Fig. 2.

Associations between mutation profile and heterogeneity at the histologic and molecular levels. (A) Associations between mutation profile and histologic types. MMS and MMD were classified together. (B) Heat map of mutation profile in tumor samples along the E.score and S.score (n = 231). Distribution of mutations is shown only for genes, which are characterized by a significant association with the E.score or the S.score. Histogram on the right corresponds to −log10 (P‐value) of the Student's t‐test comparing for a specific gene the E.score or the S.score between MPM with or without any alterations. The black dashed line corresponds to a P‐value threshold of 0.05. (C) Associations between mutation profile and transcriptomic subtypes C1 and C2. (D) Associations between mutation profile and transcriptomic subtypes C1A and C2B. P‐values were determined by the Fisher's exact tests (*P < 0.05; **P < 0.01; ***P < 0.001) (A, C, and D). WT, wild‐type; M, mutated; M1, nonsense substitutions, inframe or frameshift indels and splice sites; M2, missense substitutions damaging; M3, missense substitutions probably damaging.
