
Fig. 3.
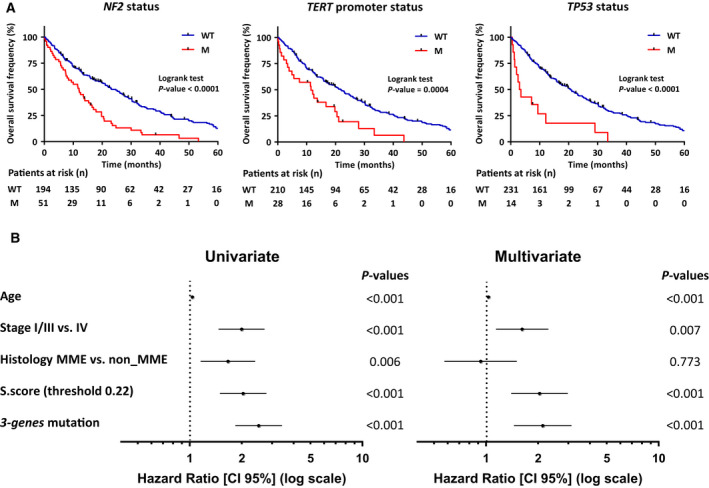
Associations between mutation profile and overall survival. (A) Kaplan–Meier plots of overall survival in patients with wild‐type (blue curve) or mutated (red curve) NF2, TERT promoter, and TP53. P‐values were determined by the Log‐rank tests. (B) Univariate and multivariate Cox regression analysis of overall survival in MPM patients. Forest plots show hazard ratios (HR) and 95% confidence interval (CI) for overall survival according to age at diagnostic, tumor stage, histology, and S.score based on a threshold of 0.22 and mutation status. For histology, MMB, MMS, and MMD were classified as non_MME. For mutation status, samples were discriminated for the presence or the absence of at least one mutation in one of the genes TP53 or NF2, or in the TERT promoter (3‐gene mutation). P‐values of the Wald test for all variables are indicated at the right of each forest plot. WT, wild‐type; M, mutated.