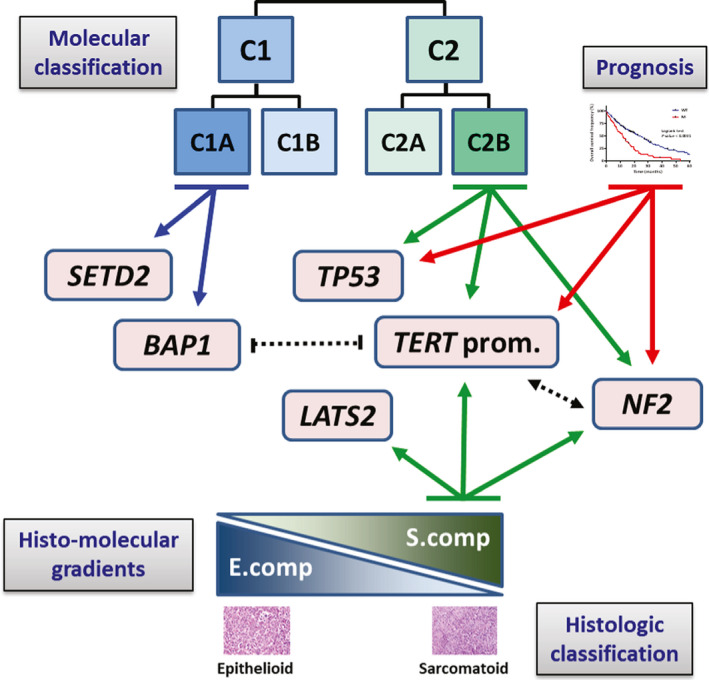
Fig. 5.

Schematic representation of the link between the genetic landscape and tumor heterogeneity in MPM. Solid lines with arrows indicate significant associations between mutated genes and histologic or molecular classifications, histo‐molecular gradients or prognosis. Dotted lines with arrows or dashes indicate significant association or exclusion between mutated genes, respectively.
