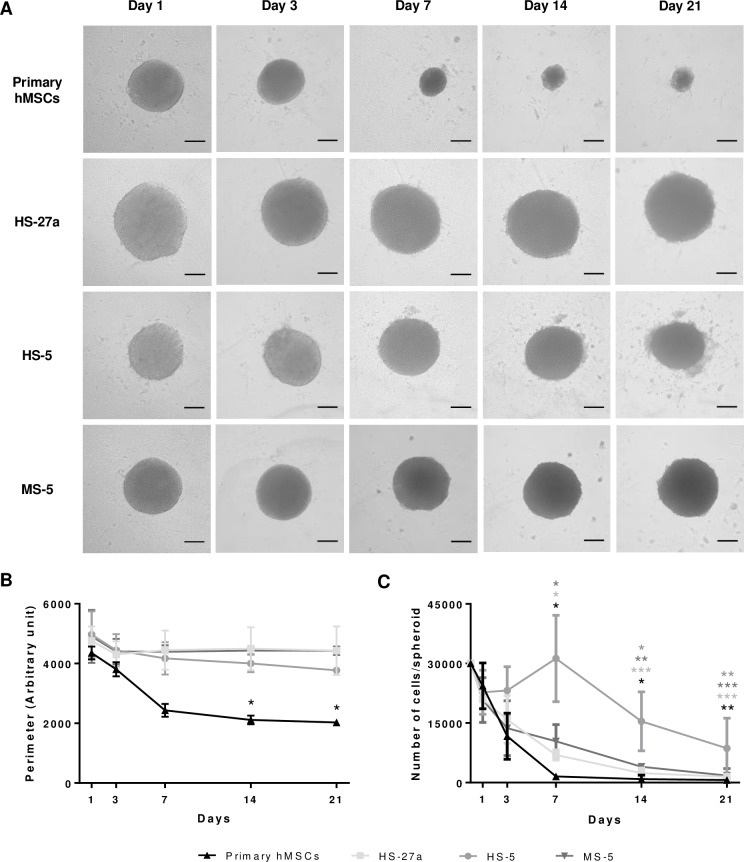
Fig 2. Follow up of the spheroids from various MSCs.
(A) Microscopy analysis of primary hMSC-, HS-27a-, HS-5- and MS-5-spheroids over 21 days in culture (scale bars = 100 μm). (B) Perimeter was measured with an arbitrary unit; each experiment is the mean of at least 10 spheroids from n = 3 experiments. Data are shown as mean ± SD; * compared to day 1; * p ≤ 0.01. (C) Number of living cells per spheroid over 21 days in culture (primary hMCSs and MS-5 n = 3; HS-27a and HS-5 n = 4). Data are shown as mean ± SD; *, **, *** compared to day 0; * p ≤ 0.05; ** p ≤ 0.01; *** p ≤ 0.001.

