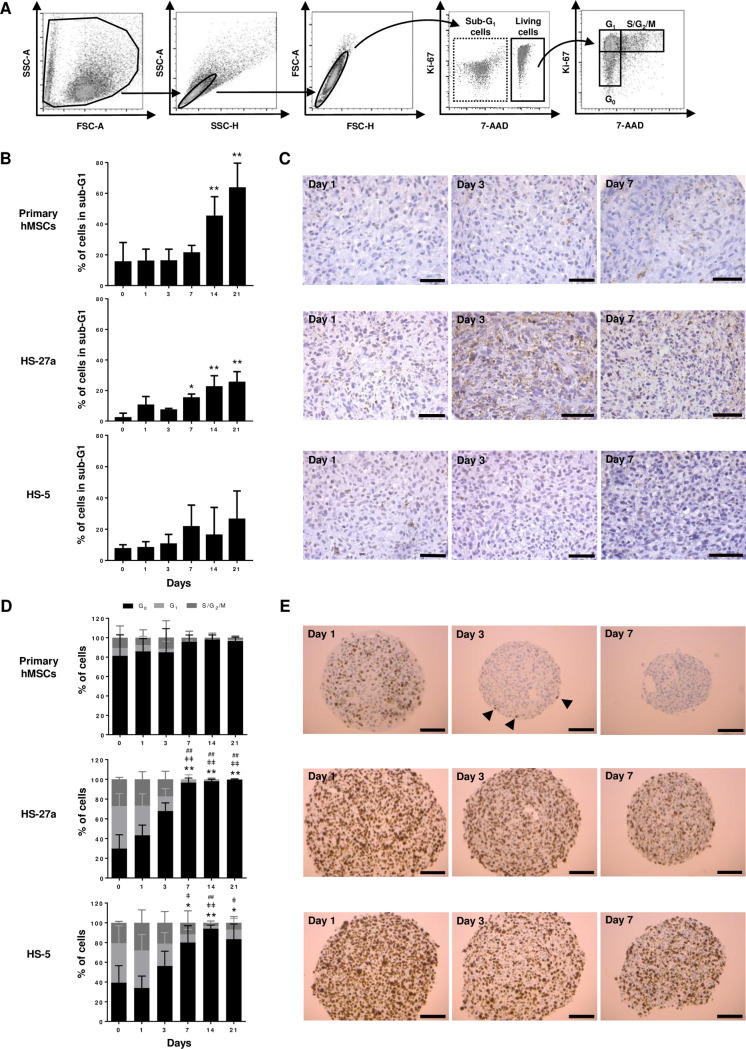
Fig 4. Determination of proliferation and apoptosis of MSC-spheroids.
(A, B and D) Cell cycle analysis of spheroids over 21 days in culture. (A) Representative gating strategy from primary hMSCs at day 0, (B) sub-G1 apoptosis quantification (primary hMSCs n = 6; HS-27a and HS-5 n = 3) and (D) cell cycle quantification (primary hMSCs n = 6; HS-27a and HS-5 n = 5; * for G0; ǂ for G1; # for S/G2/M) (data are mean ± SD; *, ǂ, # compared to day 0; *, ǂ p ≤ 0.05; **, ǂǂ, ## p ≤ 0.01). (C and E) Immunohistochemistry of (C) caspase-3 and (E) Ki-67 at days 1, 3 and 7 for primary hMSC-, HS-27a- and HS-5-spheroids (scale bars = 50 μm (C) and 100 μm (E)). Arrow heads indicate Ki-67-positive cells.

